32  Random Forest Imputation and SVM Multi-class Classifier

\(~\)

\(~\)

32.1 NHANES data

#install.packages('LiblineaR')


library('tidyverse')
── Attaching core tidyverse packages ──────────────────────── tidyverse 2.0.0 ──
✔ dplyr     1.1.4     ✔ readr     2.1.5
✔ forcats   1.0.0     ✔ stringr   1.5.1
✔ ggplot2   3.5.1     ✔ tibble    3.2.1
✔ lubridate 1.9.3     ✔ tidyr     1.3.1
✔ purrr     1.0.2     
── Conflicts ────────────────────────────────────────── tidyverse_conflicts() ──
✖ dplyr::filter() masks stats::filter()
✖ dplyr::lag()    masks stats::lag()
ℹ Use the conflicted package (<http://conflicted.r-lib.org/>) to force all conflicts to become errors
library(NHANES)

NHANES_DATA_12 <- NHANES %>%
  filter(!is.na(Depressed))

32.1.1 Note that Depressed is has 3 potiential classes

NHANES_DATA_12 %>% 
  select(Depressed) %>%
  distinct()
# A tibble: 3 × 1
  Depressed
  <fct>    
1 Several  
2 None     
3 Most     

\(~\)

\(~\)


\(~\)

\(~\)

32.2 Some data prep

SumNa <- function(col){sum(is.na(col))}

data.sum <- NHANES_DATA_12 %>% 
  summarise_all(SumNa) %>%
  tidyr::gather(key='feature', value='SumNa') %>%
  arrange(-SumNa) %>%
  mutate(PctNa = SumNa/nrow(NHANES_DATA_12))

data.sum2 <- data.sum %>% 
  filter(! (feature %in% c('ID','Depressed'))) %>%
  filter(PctNa < .85)

data.sum2$feature
 [1] "UrineFlow2"      "UrineVol2"       "AgeRegMarij"     "PregnantNow"    
 [5] "Age1stBaby"      "nBabies"         "nPregnancies"    "SmokeAge"       
 [9] "AgeFirstMarij"   "SmokeNow"        "Testosterone"    "AgeMonths"      
[13] "TVHrsDay"        "Race3"           "CompHrsDay"      "PhysActiveDays" 
[17] "SexOrientation"  "AlcoholDay"      "SexNumPartYear"  "Marijuana"      
[21] "RegularMarij"    "SexAge"          "SexNumPartnLife" "HardDrugs"      
[25] "SexEver"         "SameSex"         "AlcoholYear"     "HHIncome"       
[29] "HHIncomeMid"     "Poverty"         "UrineFlow1"      "BPSys1"         
[33] "BPDia1"          "AgeDecade"       "DirectChol"      "TotChol"        
[37] "BPSys2"          "BPDia2"          "Education"       "BPSys3"         
[41] "BPDia3"          "MaritalStatus"   "Smoke100"        "Smoke100n"      
[45] "Alcohol12PlusYr" "BPSysAve"        "BPDiaAve"        "Pulse"          
[49] "BMI_WHO"         "BMI"             "Weight"          "HomeRooms"      
[53] "Height"          "HomeOwn"         "UrineVol1"       "SleepHrsNight"  
[57] "LittleInterest"  "DaysPhysHlthBad" "DaysMentHlthBad" "Diabetes"       
[61] "Work"            "SurveyYr"        "Gender"          "Age"            
[65] "Race1"           "HealthGen"       "SleepTrouble"    "PhysActive"     
data_F <- NHANES_DATA_12 %>% 
  select(ID, Depressed, data.sum2$feature) %>%
  filter(!is.na(Depressed))

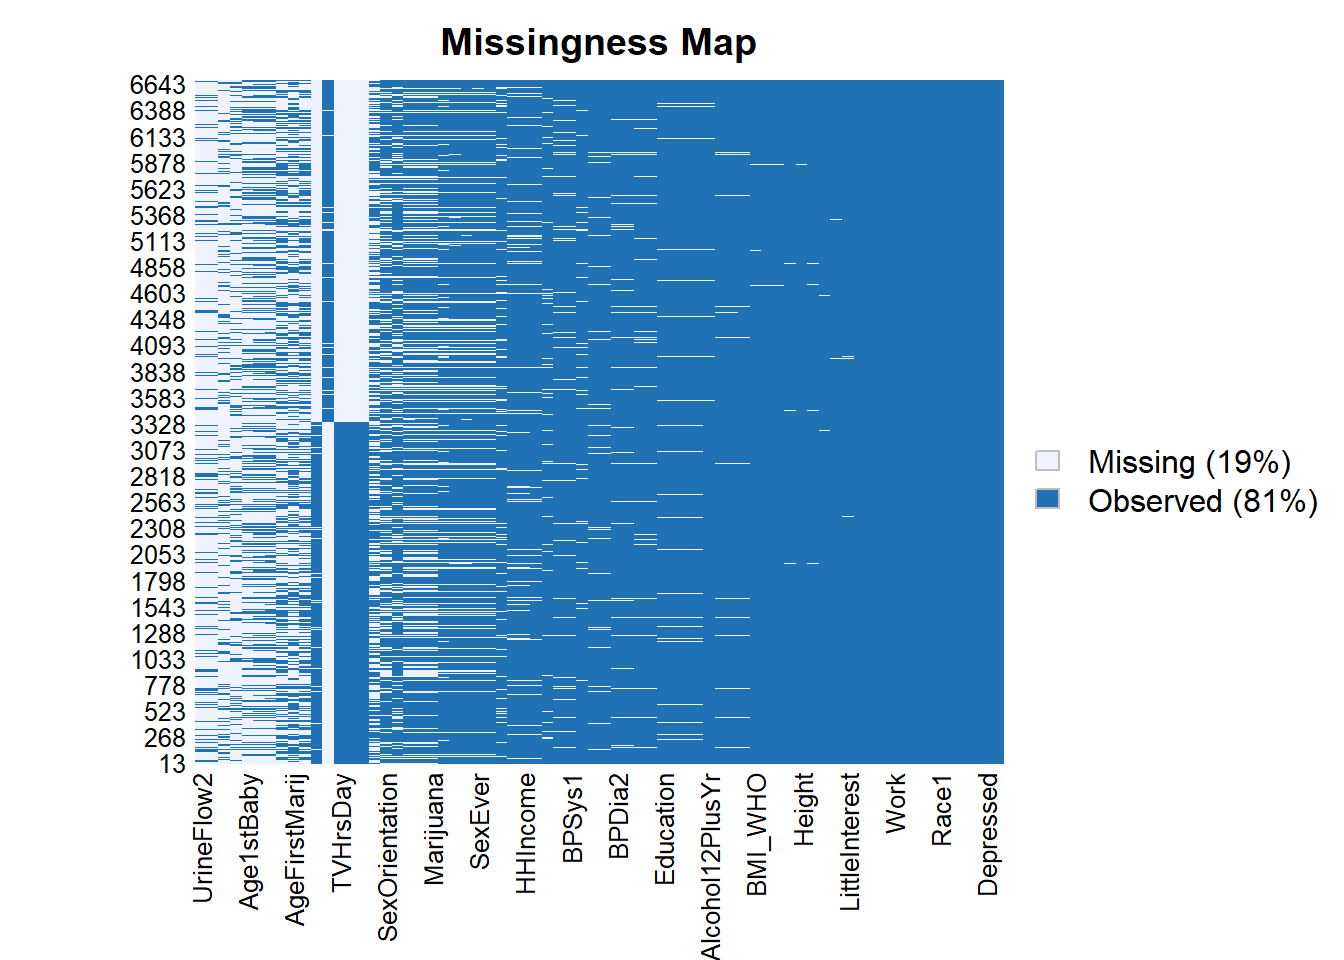
32.2.1 note that data_F still has missing values

Amelia::missmap(as.data.frame(data_F))

\(~\)

\(~\)


\(~\)

\(~\)

32.3 Random Forest Impute with rfImpute

randomForest 4.7-1.1
Type rfNews() to see new features/changes/bug fixes.

Attaching package: 'randomForest'
The following object is masked from 'package:dplyr':

    combine
The following object is masked from 'package:ggplot2':

    margin
data_F.imputed <- rfImpute(Depressed ~ . , 
                           data_F, 
                           iter=2, 
                           ntree=300)
ntree      OOB      1      2      3
  300:   8.41%  0.88% 37.86% 31.82%
ntree      OOB      1      2      3
  300:   8.69%  1.24% 37.26% 33.25%

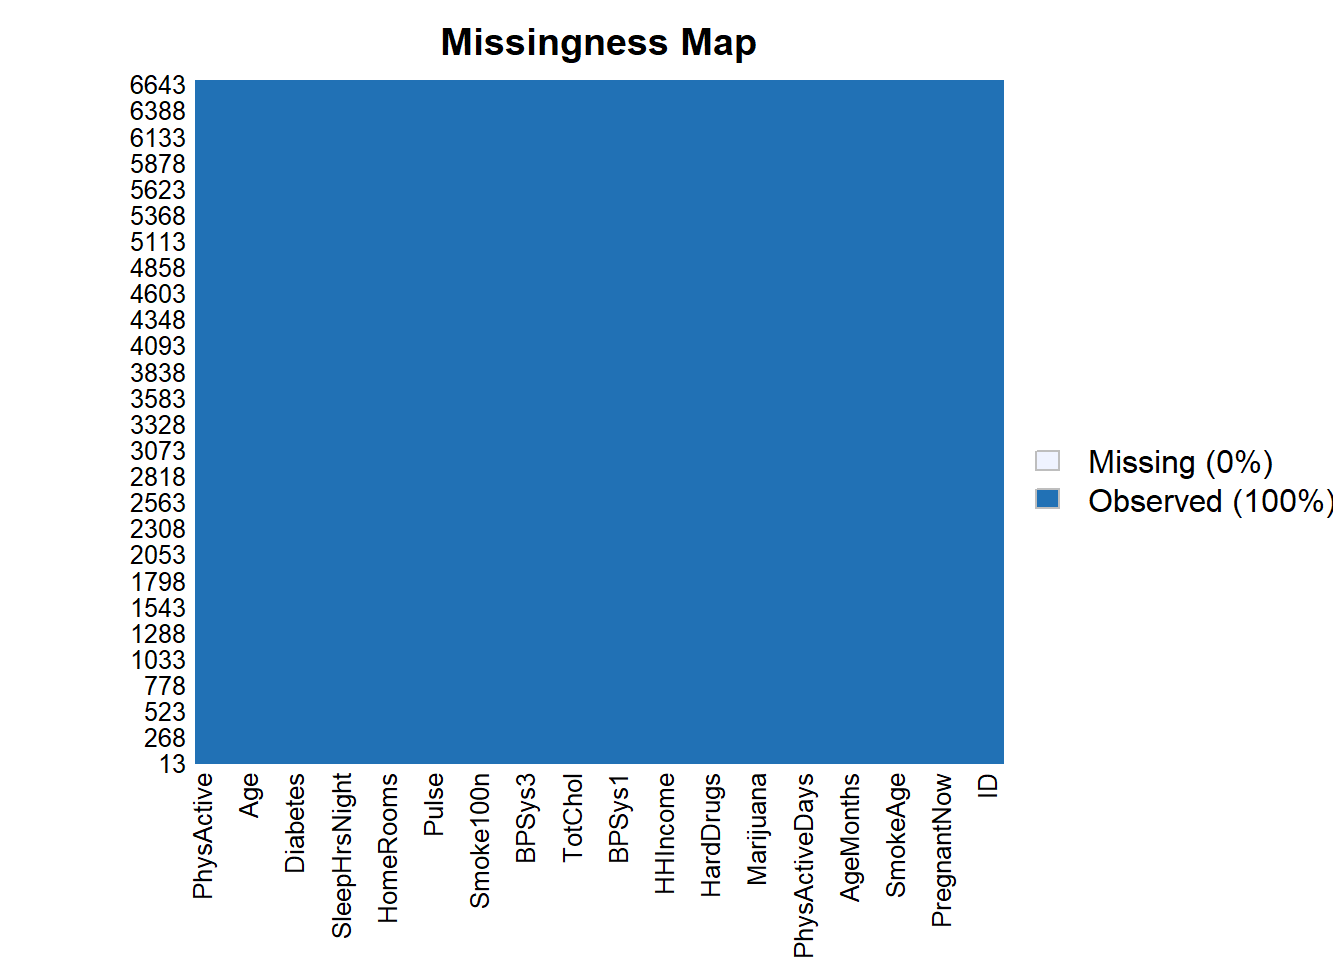
32.3.0.1 Note we no longer have missing data

Amelia::missmap(as.data.frame(data_F.imputed))

\(~\)

\(~\)


\(~\)

\(~\)

32.4 Split Data

Loading required package: lattice

Attaching package: 'caret'
The following object is masked from 'package:purrr':

    lift
set.seed(8576309)

trainIndex <- createDataPartition(data_F.imputed$Depressed, 
                                  p = .6, 
                                  list = FALSE, 
                                  times = 1)

TRAIN <- data_F.imputed[trainIndex, ]
TEST <- data_F.imputed[-trainIndex, ]

\(~\)

\(~\)


\(~\)

\(~\)

32.5 Train model

To see list of models compatible and tuneable hyperparameters within the caret package you can visit: https://topepo.github.io/caret/available-models.html

SVMGrid <- expand.grid(cost = c(1,2,5), Loss = c(1,5,6))

train_ctrl <- trainControl(method="cv", # type of resampling in this case Cross-Validated
                           number=3)

toc <- Sys.time()
model_svm <- train(Depressed ~ .,
                       data = TRAIN,
                       method = "svmLinear3", # this will use the svmLinear3 library
                       metric = "Accuracy", # which metric should be optimized for 
                       trControl = train_ctrl,
                       tuneGrid = SVMGrid) 
tic <- Sys.time()

tic - toc
Time difference of 38.81407 secs

32.5.1 Model output

model_svm
L2 Regularized Support Vector Machine (dual) with Linear Kernel 

4005 samples
  69 predictor
   3 classes: 'None', 'Several', 'Most' 

No pre-processing
Resampling: Cross-Validated (3 fold) 
Summary of sample sizes: 2670, 2669, 2671 
Resampling results across tuning parameters:

  cost  Loss  Accuracy   Kappa      
  1     1     0.6631711  0.013007576
  1     5     0.5357612  0.004280989
  1     6     0.6512719  0.048603102
  2     1     0.7565349  0.051560339
  2     5     0.4650565  0.070901994
  2     6     0.6824747  0.025679637
  5     1     0.7835188  0.004424675
  5     5     0.1959271  0.023878197
  5     6     0.7860176  0.000000000

Accuracy was used to select the optimal model using the largest value.
The final values used for the model were cost = 5 and Loss = 6.
varImp(model_svm)
ROC curve variable importance

  variables are sorted by maximum importance across the classes
  only 20 most important variables shown (out of 69)

                  None Several   Most
DaysMentHlthBad 100.00   70.34 100.00
LittleInterest   90.65   57.64  90.65
Age1stBaby       78.42   50.99  78.42
SmokeNow         57.83   38.10  57.83
HealthGen        51.05   30.48  51.05
HHIncome         45.06   26.34  45.06
Poverty          43.94   25.47  43.94
nPregnancies     41.70   30.68  41.70
HHIncomeMid      39.67   23.78  39.67
Education        39.44   25.66  39.44
DaysPhysHlthBad  34.63   19.10  34.63
SleepTrouble     33.58   19.72  33.58
Work             33.02   23.56  33.02
SleepHrsNight    32.03   17.33  32.03
Testosterone     31.72   22.65  31.72
HomeRooms        31.38   17.07  31.38
nBabies          31.13   17.79  31.13
PregnantNow      31.13   18.41  31.13
TVHrsDay         30.26   27.76  30.26
PhysActive       29.62   15.26  29.62
plot(varImp(model_svm), top = 20)