23  Random Forest Regression

\(~\)

\(~\)

\(~\)

23.1 Read in the Data

install_if_not <- function( list.of.packages ) {
  new.packages <- list.of.packages[!(list.of.packages %in% installed.packages()[,"Package"])]
  if(length(new.packages)) { install.packages(new.packages) } else { print(paste0("the package '", list.of.packages , "' is already installed")) }
}

library('tidyverse')
── Attaching core tidyverse packages ──────────────────────── tidyverse 2.0.0 ──
✔ dplyr     1.1.4     ✔ readr     2.1.5
✔ forcats   1.0.0     ✔ stringr   1.5.1
✔ ggplot2   3.5.1     ✔ tibble    3.2.1
✔ lubridate 1.9.3     ✔ tidyr     1.3.1
✔ purrr     1.0.2     
── Conflicts ────────────────────────────────────────── tidyverse_conflicts() ──
✖ dplyr::filter() masks stats::filter()
✖ dplyr::lag()    masks stats::lag()
ℹ Use the conflicted package (<http://conflicted.r-lib.org/>) to force all conflicts to become errors
library(NHANES)

NHANES_DATA_12 <- NHANES %>% 
  select(-DiabetesAge) %>%
  filter(SurveyYr =='2011_12') 

SumNa <- function(col){sum(is.na(col))}

data.sum <- NHANES_DATA_12 %>% 
  summarise_all(SumNa) %>%
  tidyr::gather(key='feature', value='SumNa') %>%
  arrange(-SumNa) %>%
  mutate(PctNa = SumNa/nrow(NHANES_DATA_12))

data.sum2 <- data.sum %>% 
  filter(! (feature %in% c('ID','Diabetes'))) %>%
  filter(PctNa < .55)

data.sum2$feature
 [1] "PhysActiveDays"  "SexOrientation"  "SexNumPartYear"  "Marijuana"      
 [5] "RegularMarij"    "AlcoholDay"      "SexAge"          "SexNumPartnLife"
 [9] "HardDrugs"       "SexEver"         "SameSex"         "AlcoholYear"    
[13] "LittleInterest"  "Depressed"       "Alcohol12PlusYr" "Education"      
[17] "MaritalStatus"   "Smoke100"        "Smoke100n"       "DaysPhysHlthBad"
[21] "DaysMentHlthBad" "HealthGen"       "SleepHrsNight"   "Work"           
[25] "SleepTrouble"    "BPSys1"          "BPDia1"          "Testosterone"   
[29] "PhysActive"      "BPSys2"         
 [ reached getOption("max.print") -- omitted 27 entries ]
data_F <- NHANES_DATA_12 %>% 
  select(ID, Diabetes, data.sum2$feature) %>%
  filter(!is.na(Diabetes)) %>%
  na.omit()

\(~\)


\(~\)

\(~\)

23.2 Split Data into Training and Test Sets.

diab_pop.no_na_vals <- data_F


library('caret')
Loading required package: lattice

Attaching package: 'caret'
The following object is masked from 'package:purrr':

    lift
# this will ensure our results are the same every run, to randomize you may use: set.seed(Sys.time())
set.seed(8675309)


# The createDataPartition function is used to create training and test sets
trainIndex <- createDataPartition(diab_pop.no_na_vals$SexNumPartnLife, 
                                  p = .6, 
                                  list = FALSE, 
                                  times = 1)

TRAIN <- diab_pop.no_na_vals[trainIndex, ]
TEST <- diab_pop.no_na_vals[-trainIndex, ]

\(~\)

\(~\)

\(~\)

23.3 Train randomForest model

install_if_not('randomForest')
[1] "the package 'randomForest' is already installed"
randomForest 4.7-1.1
Type rfNews() to see new features/changes/bug fixes.

Attaching package: 'randomForest'
The following object is masked from 'package:dplyr':

    combine
The following object is masked from 'package:ggplot2':

    margin
rf_model <- randomForest(SexNumPartnLife ~ . ,
                         data = TRAIN,
                         ntree= 550,
                         mtry=3,
                         keep.forest=TRUE,
                         importance=TRUE)

rf_model

Call:
 randomForest(formula = SexNumPartnLife ~ ., data = TRAIN, ntree = 550,      mtry = 3, keep.forest = TRUE, importance = TRUE) 
               Type of random forest: regression
                     Number of trees: 550
No. of variables tried at each split: 3

          Mean of squared residuals: 1793.489
                    % Var explained: 56.18

\(~\)

\(~\)

23.3.1 Random Forest is a Collection of Decision Trees

str(rf_model, 1)
List of 18
 $ call           : language randomForest(formula = SexNumPartnLife ~ ., data = TRAIN, ntree = 550,      mtry = 3, keep.forest = TRUE, importance = TRUE)
 $ type           : chr "regression"
 $ predicted      : Named num [1:397] 20.06 27.64 10.17 13.01 6.45 ...
  ..- attr(*, "names")= chr [1:397] "1" "2" "3" "4" ...
 $ mse            : num [1:550] 850 1211 2423 2432 2195 ...
 $ rsq            : num [1:550] 0.792 0.704 0.408 0.406 0.464 ...
 $ oob.times      : int [1:397] 201 199 203 210 210 201 217 209 209 211 ...
 $ importance     : num [1:58, 1:2] 239.114 1.18 -6.598 -0.108 327.648 ...
  ..- attr(*, "dimnames")=List of 2
 $ importanceSD   : Named num [1:58] 65.95 0.682 11.491 0.213 87.597 ...
  ..- attr(*, "names")= chr [1:58] "ID" "Diabetes" "PhysActiveDays" "SexOrientation" ...
 $ localImportance: NULL
 $ proximity      : NULL
 $ ntree          : num 550
 $ mtry           : num 3
 $ forest         :List of 11
 $ coefs          : NULL
 $ y              : Named num [1:397] 6 4 20 1 5 5 5 15 8 3 ...
  ..- attr(*, "names")= chr [1:397] "1" "2" "3" "4" ...
 $ test           : NULL
 $ inbag          : NULL
 $ terms          :Classes 'terms', 'formula'  language SexNumPartnLife ~ ID + Diabetes + PhysActiveDays + SexOrientation + SexNumPartYear +      Marijuana + RegularMari| __truncated__ ...
  .. ..- attr(*, "variables")= language list(SexNumPartnLife, ID, Diabetes, PhysActiveDays, SexOrientation, SexNumPartYear,      Marijuana, RegularMarij,| __truncated__ ...
  .. ..- attr(*, "factors")= int [1:59, 1:58] 0 1 0 0 0 0 0 0 0 0 ...
  .. .. ..- attr(*, "dimnames")=List of 2
  .. ..- attr(*, "term.labels")= chr [1:58] "ID" "Diabetes" "PhysActiveDays" "SexOrientation" ...
  .. ..- attr(*, "order")= int [1:58] 1 1 1 1 1 1 1 1 1 1 ...
  .. ..- attr(*, "intercept")= num 0
  .. ..- attr(*, "response")= int 1
  .. ..- attr(*, ".Environment")=<environment: R_GlobalEnv> 
  .. ..- attr(*, "predvars")= language list(SexNumPartnLife, ID, Diabetes, PhysActiveDays, SexOrientation, SexNumPartYear,      Marijuana, RegularMarij,| __truncated__ ...
  .. ..- attr(*, "dataClasses")= Named chr [1:59] "numeric" "numeric" "factor" "numeric" ...
  .. .. ..- attr(*, "names")= chr [1:59] "SexNumPartnLife" "ID" "Diabetes" "PhysActiveDays" ...
 - attr(*, "class")= chr [1:2] "randomForest.formula" "randomForest"
getTree(rf_model, 1)
    left daughter right daughter split var split point status prediction
1               2              3        20      1.0000     -3  21.657431
2               4              5        50    119.0000     -3  11.840517
3               6              7        24      6.5000     -3  35.460606
4               8              9        36      0.8050     -3   8.873096
5              10             11        57     29.0000     -3  28.542857
 [ reached getOption("max.print") -- omitted 254 rows ]
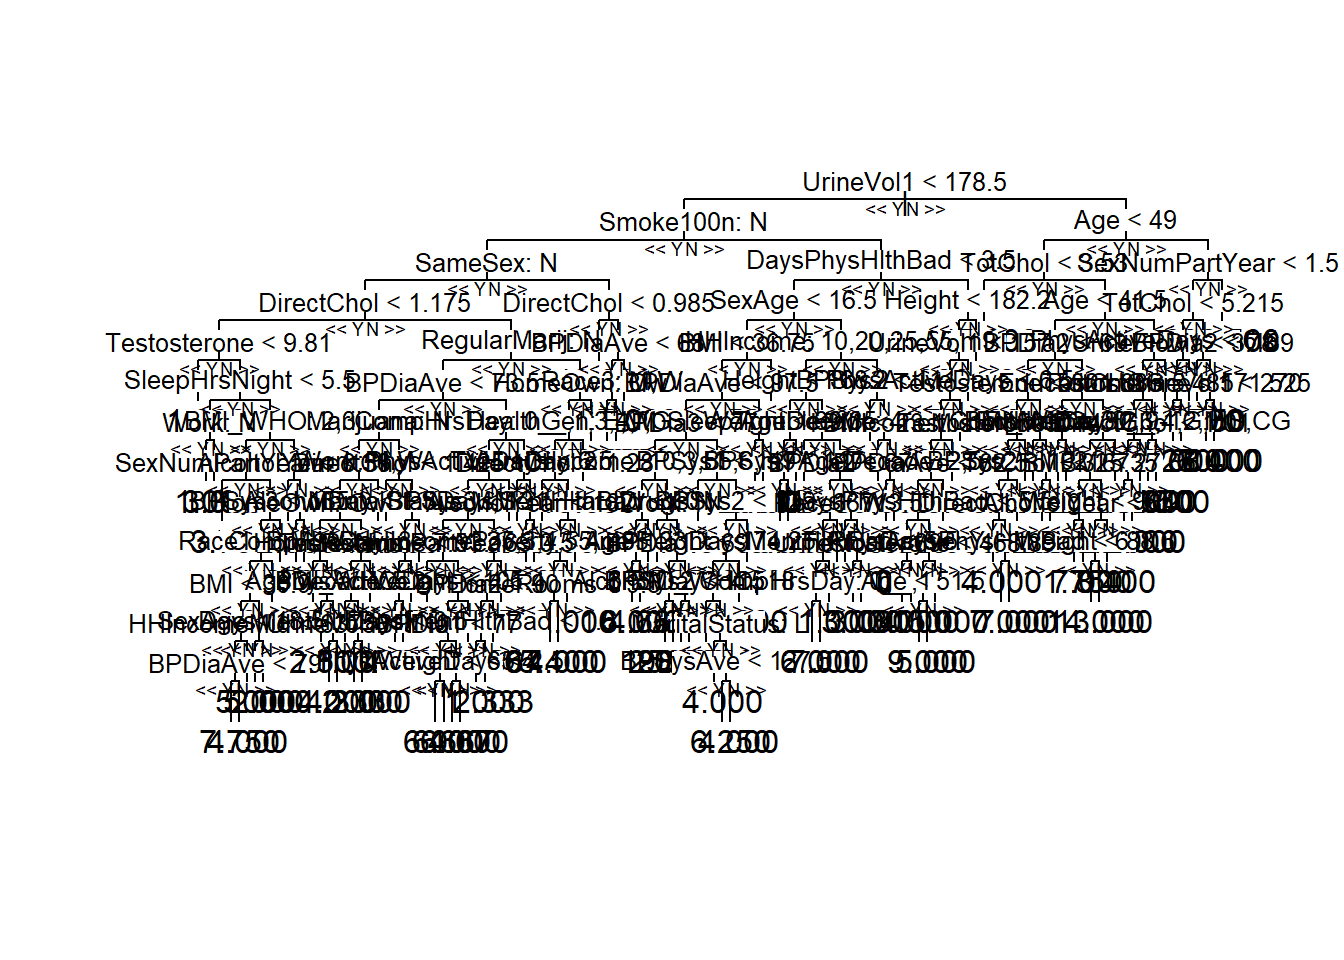
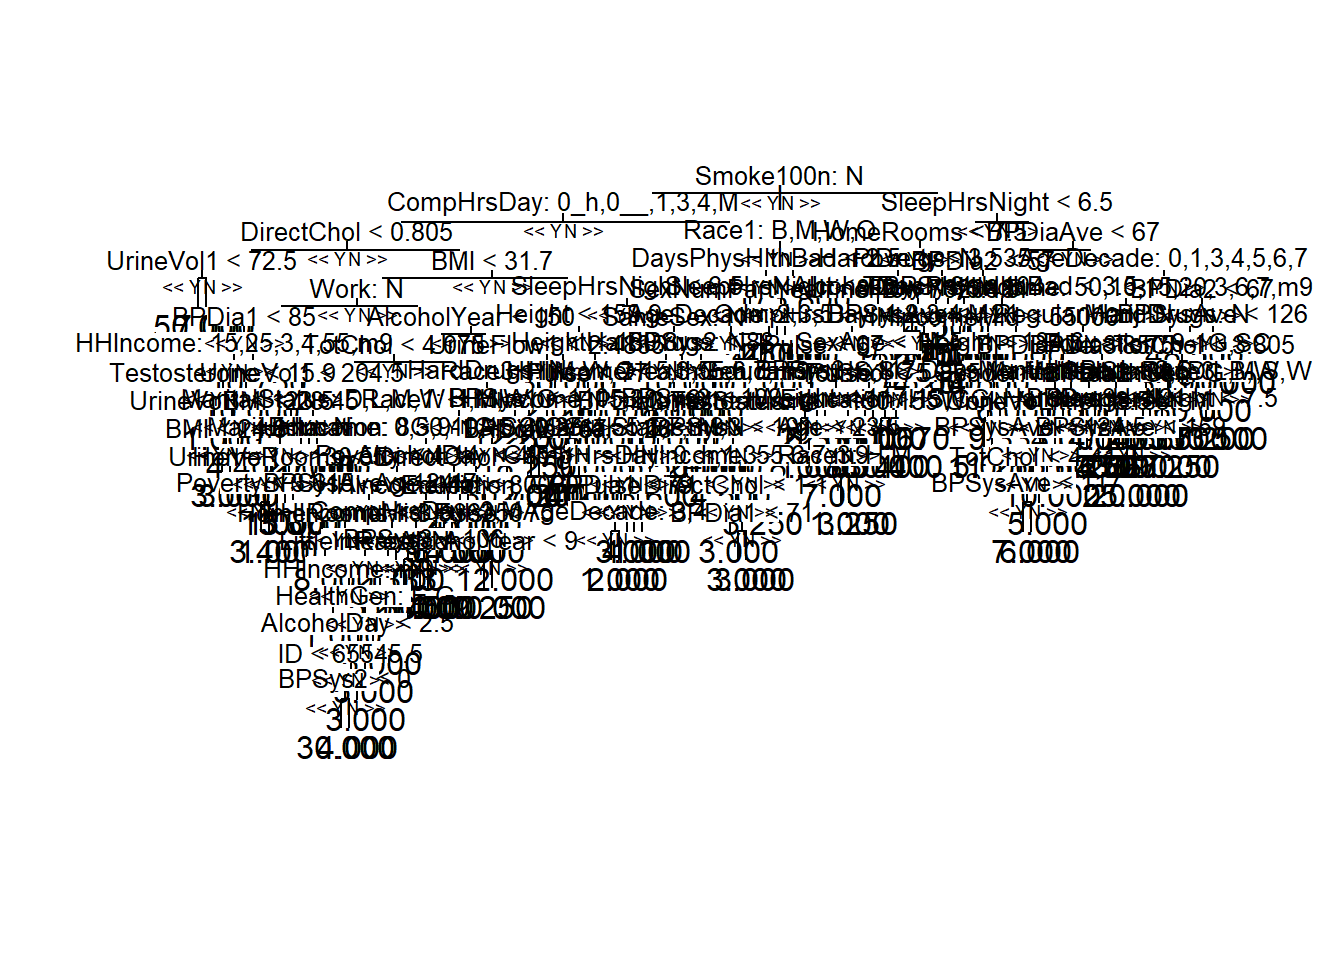
reprtree:::plot.getTree(rf_model,k=1)
Registered S3 method overwritten by 'reprtree':
  method    from
  text.tree tree
Loading required package: plotrix

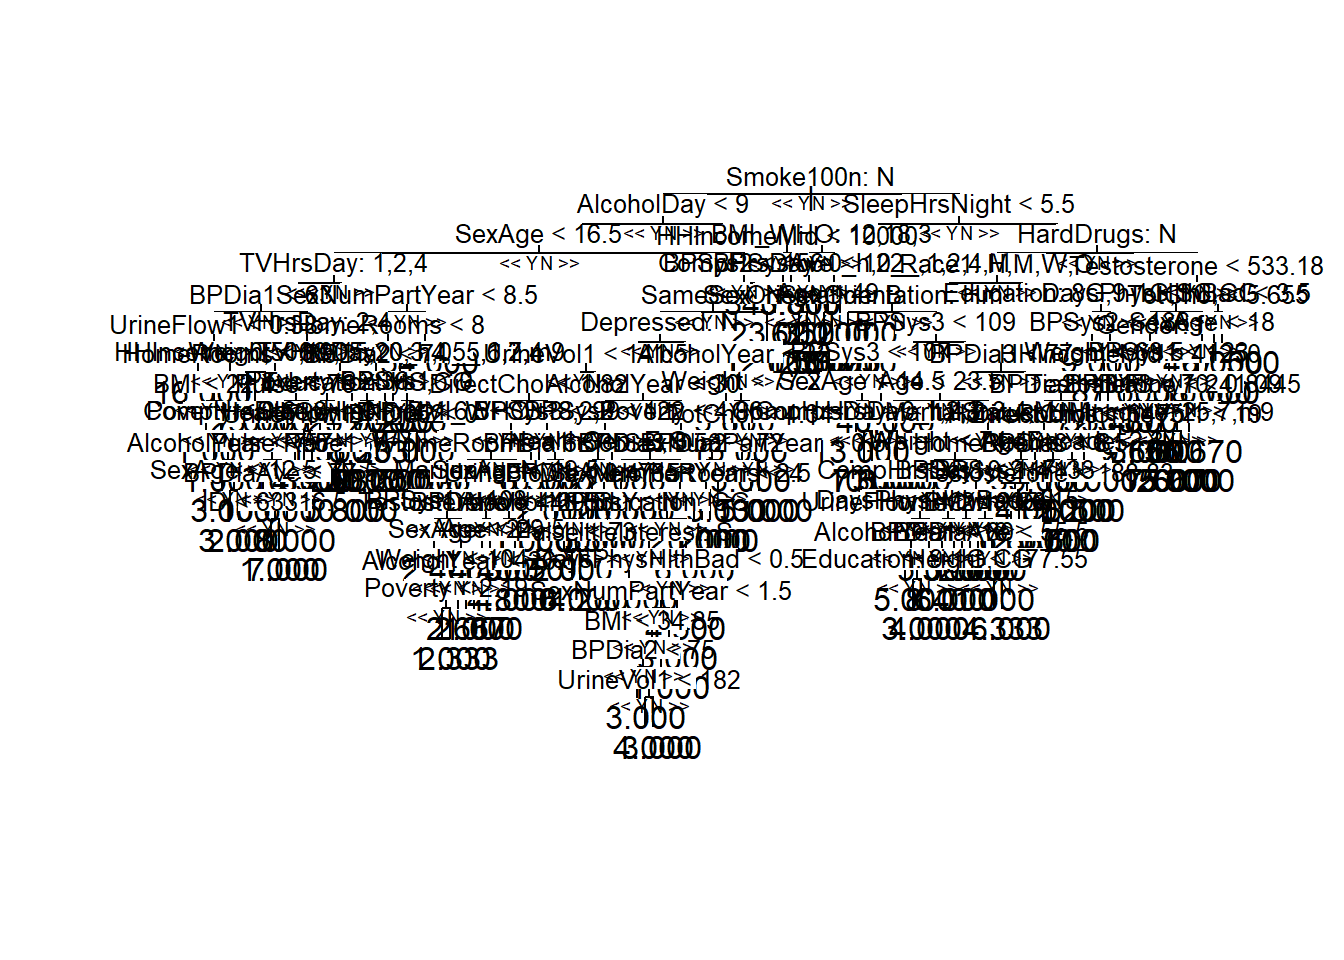
reprtree:::plot.getTree(rf_model,k=4)

reprtree:::plot.getTree(rf_model,k=500)

\(~\)

\(~\)

23.3.2 Feature Importances

varImp(rf_model)
                   Overall
ID               3.6257077
Diabetes         1.7314275
PhysActiveDays  -0.5741940
SexOrientation  -0.5066696
SexNumPartYear   3.7403828
Marijuana        2.4565804
RegularMarij     4.6999550
AlcoholDay       5.1591547
SexAge           3.8067884
HardDrugs        2.8429804
SexEver          0.0000000
SameSex          0.9616397
AlcoholYear      1.8518106
LittleInterest   1.9113983
Depressed        2.3629126
Alcohol12PlusYr  1.3638525
Education        2.1438324
MaritalStatus    3.0361751
Smoke100         2.2221353
Smoke100n        2.8860931
DaysPhysHlthBad  0.2909286
DaysMentHlthBad  0.6231740
HealthGen        2.8874822
SleepHrsNight    3.1977870
Work             0.9840099
SleepTrouble     2.0832615
BPSys1           3.9430683
BPDia1           3.2744681
Testosterone     3.3497603
PhysActive       0.8386805
 [ reached 'max' / getOption("max.print") -- omitted 28 rows ]
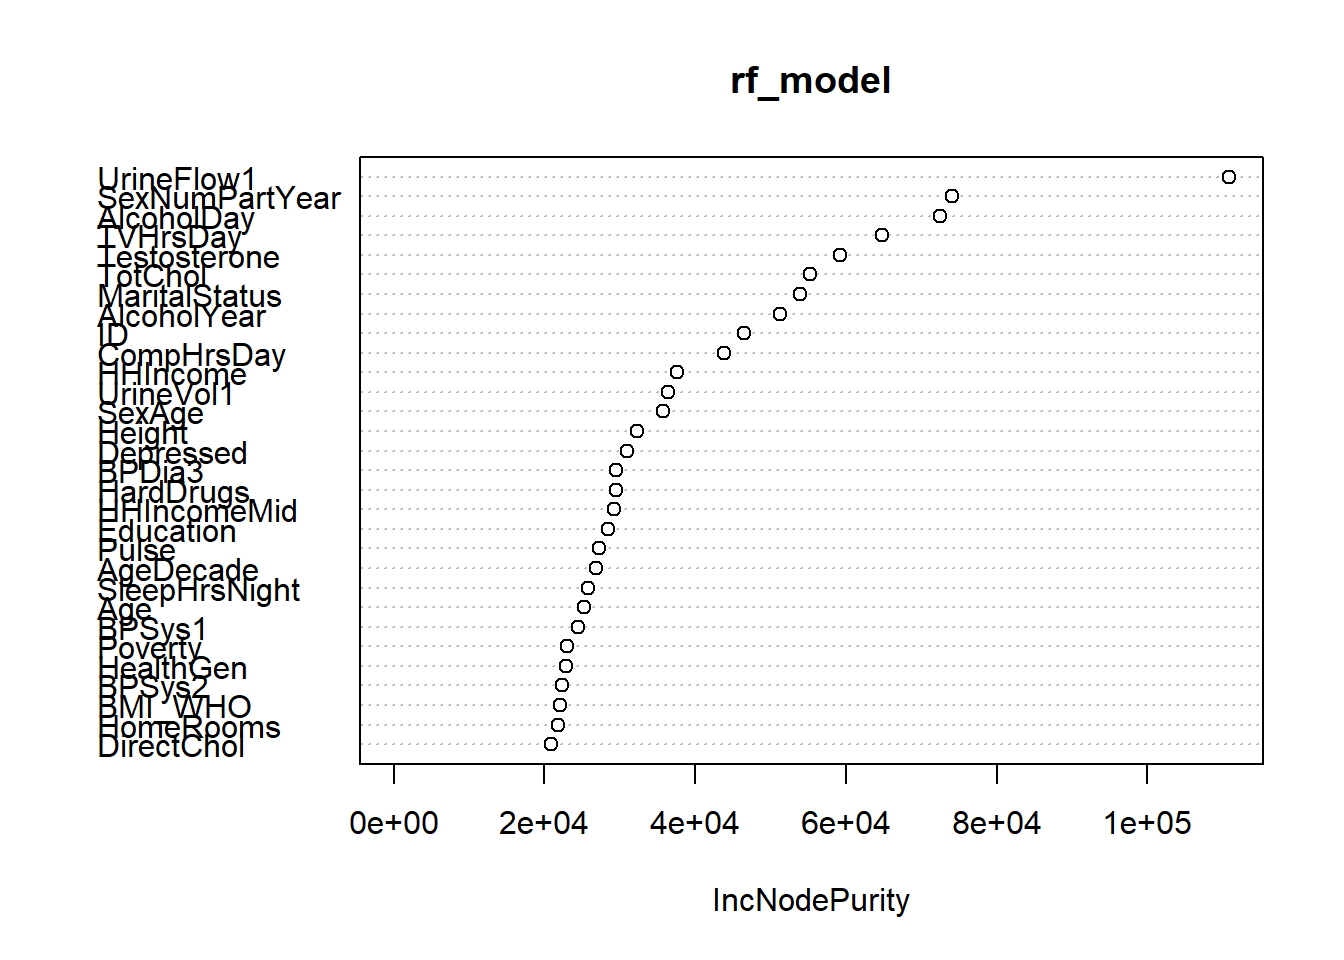
importance(rf_model)
                   %IncMSE IncNodePurity
ID               3.6257077   46471.57400
Diabetes         1.7314275     312.78004
PhysActiveDays  -0.5741940    7817.43567
SexOrientation  -0.5066696     315.21416
SexNumPartYear   3.7403828   74065.13220
Marijuana        2.4565804    2426.49283
RegularMarij     4.6999550   17813.88634
AlcoholDay       5.1591547   72433.98476
SexAge           3.8067884   35679.11104
HardDrugs        2.8429804   29474.31404
SexEver          0.0000000       0.00000
SameSex          0.9616397     391.03106
AlcoholYear      1.8518106   51286.67381
LittleInterest   1.9113983     429.16386
Depressed        2.3629126   30898.63660
 [ reached getOption("max.print") -- omitted 43 rows ]
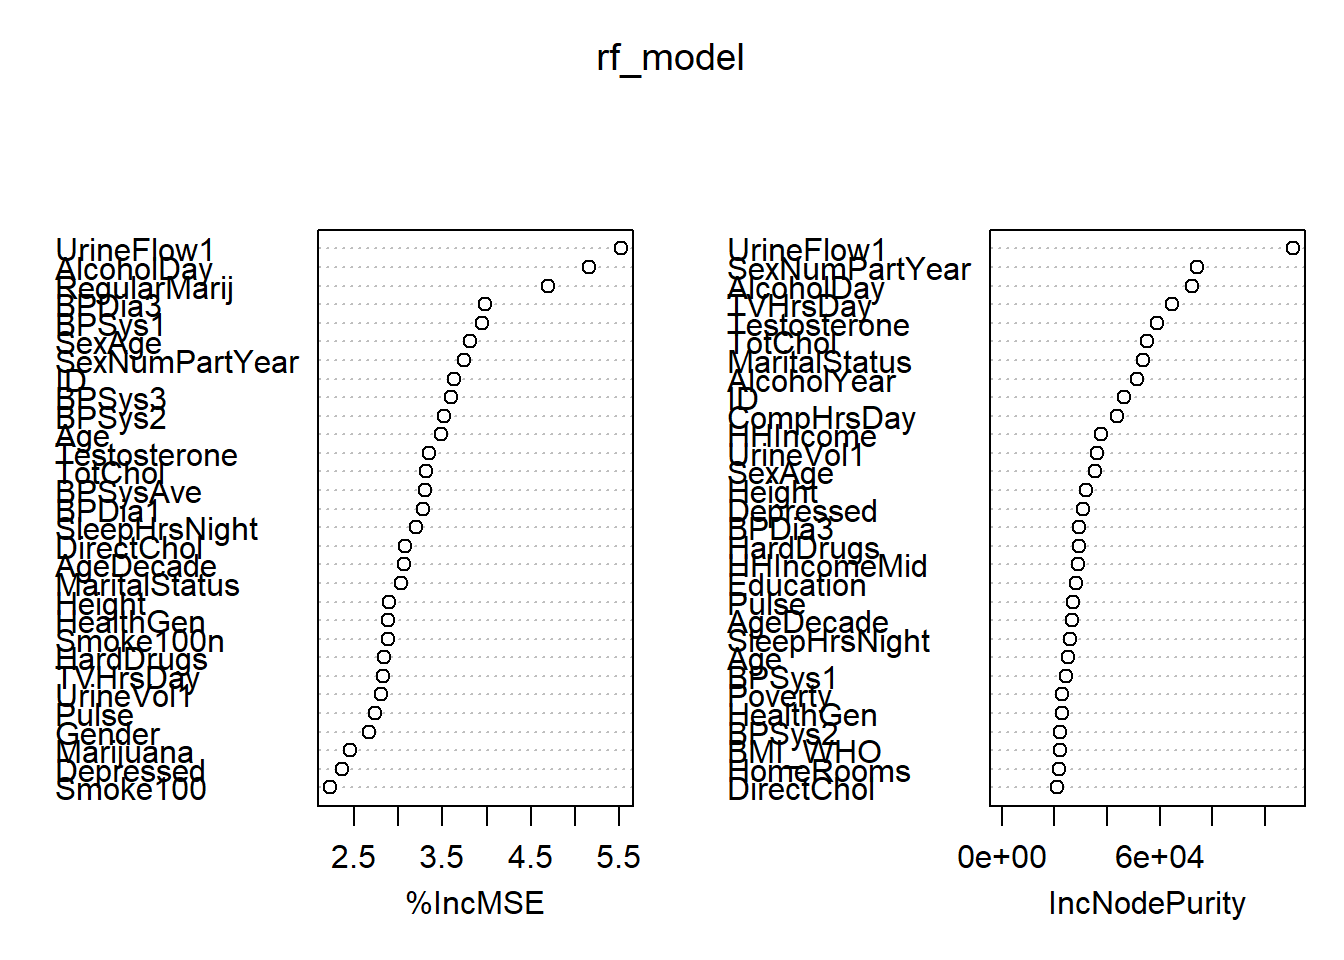
varImpPlot(rf_model)

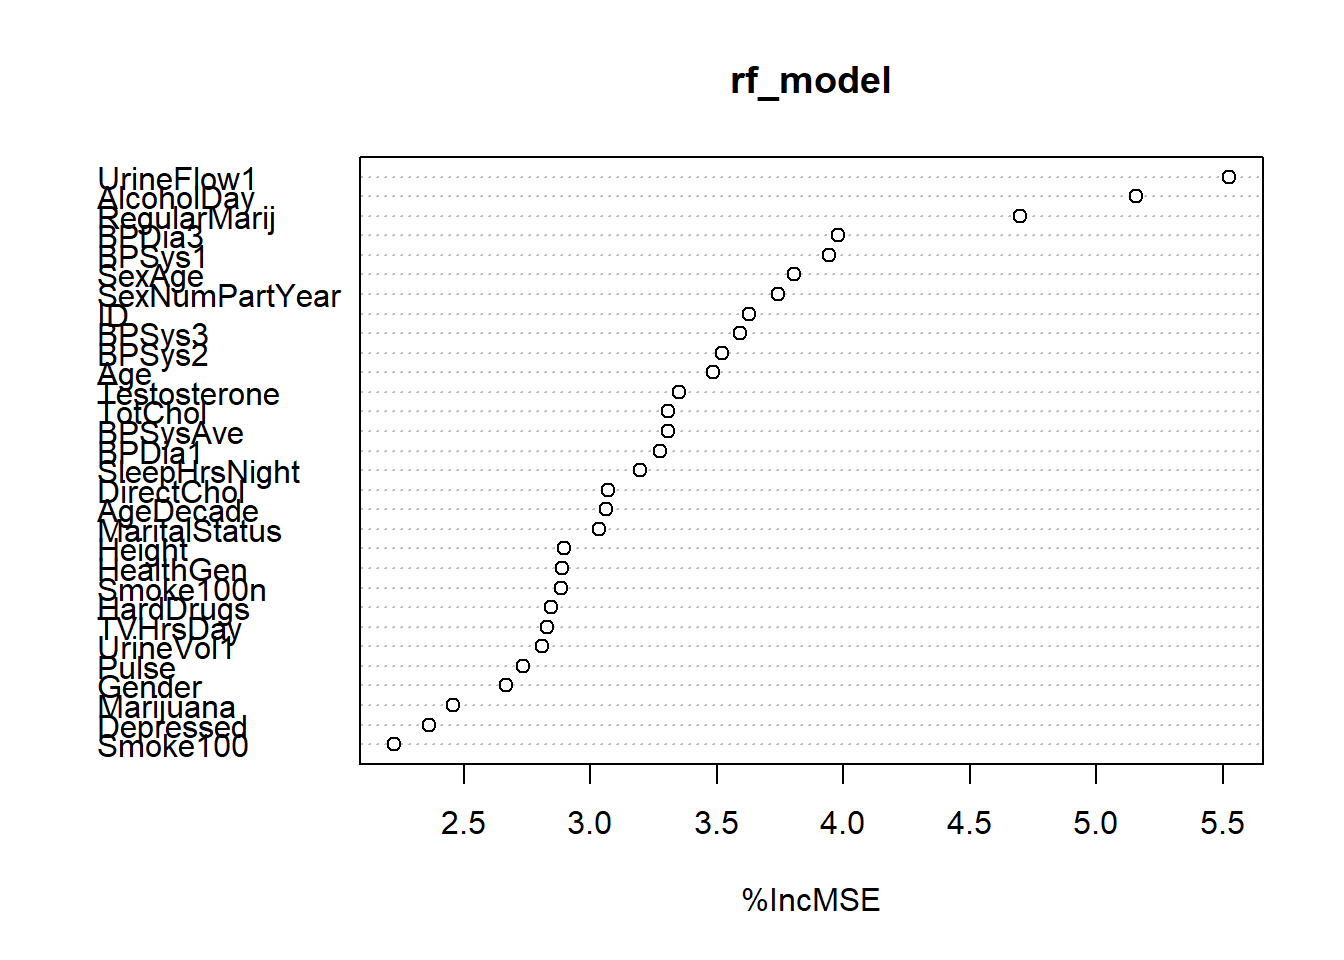
varImpPlot(rf_model, type=1)

varImpPlot(rf_model, type=2)

\(~\)

\(~\)

23.3.2.1 Score Training Set

y_hat <- predict(rf_model, TRAIN)

TRAIN.rf_scored <- as_tibble(cbind(TRAIN, y_hat))
glimpse(TRAIN.rf_scored)
Rows: 397
Columns: 60
$ ID              <int> 62199, 62205, 62220, 62231, 62340, 62340, 62340, 62350…
$ Diabetes        <fct> No, No, No, No, No, No, No, No, No, No, No, No, No, No…
$ PhysActiveDays  <int> 2, 1, 3, 3, 3, 5, 3, 2, 5, 6, 3, 7, 3, 1, 1, 2, 1, 3, …
$ SexOrientation  <fct> Homosexual, Heterosexual, Heterosexual, Heterosexual, …
$ SexNumPartYear  <int> 0, 1, 1, 1, 1, 1, 1, 1, 2, 2, 2, 1, 0, 1, 2, 2, 10, 1,…
$ Marijuana       <fct> Yes, Yes, No, No, No, No, No, Yes, Yes, Yes, No, No, N…
$ RegularMarij    <fct> No, No, No, No, No, No, No, Yes, No, No, No, No, No, N…
$ AlcoholDay      <int> 1, 3, 3, 2, 1, 1, 1, 4, 7, 4, 2, 1, 2, 1, 6, 6, 15, 2,…
$ SexAge          <int> 19, 14, 18, 14, 19, 19, 19, 16, 18, 17, 20, 17, 22, 24…
$ SexNumPartnLife <int> 6, 4, 20, 1, 5, 5, 5, 15, 8, 3, 25, 4, 1, 7, 7, 7, 300…
$ HardDrugs       <fct> Yes, No, No, No, No, No, No, Yes, Yes, No, No, No, No,…
$ SexEver         <fct> Yes, Yes, Yes, Yes, Yes, Yes, Yes, Yes, Yes, Yes, Yes,…
$ SameSex         <fct> Yes, No, No, No, No, No, No, No, Yes, No, No, No, No, …
$ AlcoholYear     <int> 260, 52, 36, 3, 12, 12, 12, 104, 260, 52, 6, 5, 104, 2…
$ LittleInterest  <fct> None, None, None, None, Most, Most, Most, None, None, …
$ Depressed       <fct> None, None, Several, None, Most, Most, Most, None, Non…
$ Alcohol12PlusYr <fct> Yes, Yes, Yes, Yes, Yes, Yes, Yes, Yes, Yes, Yes, Yes,…
$ Education       <fct> College Grad, College Grad, College Grad, High School,…
$ MaritalStatus   <fct> LivePartner, NeverMarried, NeverMarried, Married, Marr…
$ Smoke100        <fct> Yes, No, No, No, No, No, No, Yes, Yes, No, No, No, No,…
$ Smoke100n       <fct> Smoker, Non-Smoker, Non-Smoker, Non-Smoker, Non-Smoker…
$ DaysPhysHlthBad <int> 0, 0, 0, 0, 0, 0, 0, 0, 0, 0, 2, 0, 0, 0, 1, 1, 7, 2, …
$ DaysMentHlthBad <int> 1, 0, 3, 0, 26, 26, 26, 10, 3, 0, 30, 10, 4, 0, 0, 0, …
$ HealthGen       <fct> Vgood, Good, Good, Good, Vgood, Vgood, Vgood, Excellen…
$ SleepHrsNight   <int> 8, 6, 6, 4, 6, 6, 6, 6, 8, 5, 6, 7, 8, 7, 6, 6, 6, 6, …
$ Work            <fct> Working, Working, Working, Working, Working, Working, …
$ SleepTrouble    <fct> No, Yes, Yes, No, No, No, No, No, No, No, No, No, No, …
$ BPSys1          <int> 112, 116, 118, 120, 106, 106, 106, 112, 104, 112, 98, …
$ BPDia1          <int> 70, 86, 70, 70, 80, 80, 80, 66, 80, 54, 56, 68, 52, 62…
$ Testosterone    <dbl> 269.24, 466.11, 35.95, 14.90, 296.66, 296.66, 296.66, …
$ PhysActive      <fct> Yes, Yes, Yes, No, No, No, No, Yes, Yes, Yes, No, No, …
$ BPSys2          <int> 108, 122, 122, 116, 106, 106, 106, 112, 110, 116, 96, …
$ BPDia2          <int> 64, 88, 72, 70, 82, 82, 82, 64, 84, 54, 62, 64, 56, 68…
$ UrineFlow1      <dbl> 0.380, 0.355, 0.624, 0.196, 0.623, 0.623, 0.623, 0.500…
$ BPSys3          <int> 112, 122, 118, 112, 106, 106, 106, 118, 110, 112, 94, …
$ BPDia3          <int> 66, 86, 70, 68, 80, 80, 80, 70, 80, 56, 54, 68, 58, 60…
$ DirectChol      <dbl> 0.91, 1.03, 1.37, 1.53, 0.98, 0.98, 0.98, 1.86, 1.14, …
$ TotChol         <dbl> 4.42, 5.46, 5.09, 4.71, 4.16, 4.16, 4.16, 4.47, 5.25, …
$ BPSysAve        <int> 110, 122, 120, 114, 106, 106, 106, 115, 110, 114, 95, …
$ BPDiaAve        <int> 65, 87, 71, 69, 81, 81, 81, 67, 82, 55, 58, 66, 57, 64…
$ Pulse           <int> 84, 70, 62, 64, 68, 68, 68, 70, 80, 68, 78, 76, 54, 72…
$ UrineVol1       <int> 65, 22, 121, 19, 96, 96, 96, 44, 193, 26, 282, 93, 40,…
$ HHIncome        <fct> more 99999, more 99999, 55000-64999, more 99999, 25000…
$ HHIncomeMid     <int> 100000, 100000, 60000, 100000, 30000, 30000, 30000, 40…
$ Poverty         <dbl> 5.00, 5.00, 4.92, 3.92, 1.28, 1.28, 1.28, 2.72, 5.00, …
$ BMI_WHO         <fct> 25.0_to_29.9, 25.0_to_29.9, 30.0_plus, 30.0_plus, 25.0…
$ AgeDecade       <fct>  50-59,  20-29,  30-39,  40-49,  40-49,  40-49,  40-49…
$ BMI             <dbl> 28.0, 28.9, 40.4, 33.2, 25.9, 25.9, 25.9, 22.3, 25.6, …
$ Height          <dbl> 186.0, 171.4, 167.3, 164.7, 173.2, 173.2, 173.2, 162.1…
$ TVHrsDay        <fct> 1_hr, 1_hr, 2_hr, 2_hr, 3_hr, 3_hr, 3_hr, 2_hr, 0_to_1…
$ CompHrsDay      <fct> 1_hr, 3_hr, 1_hr, 0_to_1_hr, 1_hr, 1_hr, 1_hr, 2_hr, 1…
$ Weight          <dbl> 96.9, 84.8, 113.1, 90.1, 77.6, 77.6, 77.6, 58.7, 91.6,…
$ HomeRooms       <int> 4, 12, 4, 6, 6, 6, 6, 5, 9, 5, 5, 9, 6, 10, 1, 1, 8, 1…
$ HomeOwn         <fct> Rent, Own, Own, Own, Own, Own, Own, Rent, Own, Own, Re…
$ SurveyYr        <fct> 2011_12, 2011_12, 2011_12, 2011_12, 2011_12, 2011_12, …
$ Gender          <fct> male, male, female, female, male, male, male, female, …
$ Age             <int> 57, 28, 31, 48, 44, 44, 44, 43, 36, 23, 39, 30, 23, 32…
$ Race1           <fct> White, White, Black, Mexican, White, White, White, Whi…
$ Race3           <fct> White, White, Black, Mexican, White, White, White, Whi…
$ y_hat           <dbl> 13.628471, 14.382737, 15.506667, 6.655474, 5.760368, 5…
\(~\)

\(~\)

23.3.2.1.1 Confusion Matrix on Training Set
RMSE_rf_Train <- yardstick::rmse(TRAIN.rf_scored, truth=SexNumPartnLife, estimate=y_hat)

RMSE_rf_Train
# A tibble: 1 × 3
  .metric .estimator .estimate
  <chr>   <chr>          <dbl>
1 rmse    standard        22.5

\(~\)

\(~\)


\(~\)

\(~\)

23.4 Score Test Set

y_hat <- predict(rf_model, TEST)

#predict(diab_pop.no_na_vals.train.rf_model, diab_pop.no_na_vals.test, type ="prob")

test.rf_scored <- as_tibble(cbind(TEST, y_hat))

glimpse(test.rf_scored)
Rows: 263
Columns: 60
$ ID              <int> 62172, 62199, 62222, 62291, 62297, 62342, 62342, 62349…
$ Diabetes        <fct> No, No, No, No, No, No, No, No, No, No, Yes, No, No, N…
$ PhysActiveDays  <int> 2, 7, 2, 7, 3, 2, 7, 1, 7, 3, 5, 7, 7, 5, 5, 3, 7, 3, …
$ SexOrientation  <fct> Heterosexual, Homosexual, Heterosexual, Heterosexual, …
$ SexNumPartYear  <int> 2, 0, 1, 1, 1, 1, 1, 1, 1, 1, 0, 1, 1, 1, 1, 0, 1, 0, …
$ Marijuana       <fct> Yes, Yes, No, No, Yes, No, No, No, No, Yes, Yes, Yes, …
$ RegularMarij    <fct> No, No, No, No, No, No, No, No, No, No, Yes, No, No, N…
$ AlcoholDay      <int> 3, 1, 2, 3, 4, 2, 2, 2, 6, 3, 1, 1, 1, 2, 1, 1, 1, 5, …
$ SexAge          <int> 17, 19, 20, 20, 22, 19, 19, 19, 17, 16, 18, 16, 16, 13…
$ SexNumPartnLife <int> 4, 6, 1, 3, 25, 3, 3, 1, 3, 50, 5, 10, 10, 15, 1, 6, 4…
$ HardDrugs       <fct> No, Yes, No, No, Yes, No, No, No, No, Yes, No, No, No,…
$ SexEver         <fct> Yes, Yes, Yes, Yes, Yes, Yes, Yes, Yes, Yes, Yes, Yes,…
$ SameSex         <fct> No, Yes, No, No, No, No, No, Yes, No, No, No, No, No, …
$ AlcoholYear     <int> 104, 260, 52, 3, 156, 36, 36, 2, 104, 104, 2, 300, 300…
$ LittleInterest  <fct> Several, None, None, Several, Most, None, None, Severa…
$ Depressed       <fct> Most, None, None, None, None, None, None, Several, Non…
$ Alcohol12PlusYr <fct> Yes, Yes, Yes, Yes, Yes, Yes, Yes, Yes, Yes, Yes, Yes,…
$ Education       <fct> High School, College Grad, College Grad, Some College,…
$ MaritalStatus   <fct> NeverMarried, LivePartner, Married, Married, Married, …
$ Smoke100        <fct> Yes, Yes, No, No, Yes, No, No, No, No, Yes, Yes, Yes, …
$ Smoke100n       <fct> Smoker, Smoker, Non-Smoker, Non-Smoker, Smoker, Non-Sm…
$ DaysPhysHlthBad <int> 2, 0, 0, 21, 0, 0, 0, 20, 0, 0, 0, 0, 0, 5, 14, 0, 0, …
$ DaysMentHlthBad <int> 10, 1, 0, 0, 0, 0, 0, 7, 0, 3, 0, 5, 5, 0, 20, 0, 0, 3…
$ HealthGen       <fct> Good, Vgood, Good, Fair, Vgood, Good, Good, Fair, Good…
$ SleepHrsNight   <int> 8, 8, 7, 7, 7, 6, 6, 8, 9, 6, 7, 8, 8, 8, 5, 6, 8, 7, …
$ Work            <fct> NotWorking, Working, Working, Working, Working, Workin…
$ SleepTrouble    <fct> No, No, Yes, Yes, No, Yes, Yes, No, No, Yes, Yes, No, …
$ BPSys1          <int> 100, 112, 106, 122, 126, 126, 126, 116, 122, 120, 124,…
$ BPDia1          <int> 70, 70, 76, 70, 76, 84, 84, 68, 80, 90, 72, 76, 76, 56…
$ Testosterone    <dbl> 47.53, 269.24, 343.14, 257.94, 619.40, 36.68, 36.68, 3…
$ PhysActive      <fct> No, Yes, No, Yes, Yes, Yes, Yes, Yes, Yes, Yes, No, Ye…
$ BPSys2          <int> 102, 108, 108, 120, 122, 114, 114, 106, 114, 124, 122,…
$ BPDia2          <int> 68, 64, 70, 68, 72, 74, 74, 70, 78, 88, 76, 80, 80, 62…
$ UrineFlow1      <dbl> 0.645, 0.380, 1.297, 0.809, 0.448, 0.647, 0.647, 2.637…
$ BPSys3          <int> 104, 112, 100, 116, 122, 110, 110, 112, 116, 130, 118,…
$ BPDia3          <int> 76, 66, 76, 62, 76, 70, 70, 70, 70, 90, 78, 76, 76, 60…
$ DirectChol      <dbl> 1.89, 0.91, 1.32, 1.11, 1.55, 1.27, 1.27, 1.14, 0.88, …
$ TotChol         <dbl> 4.37, 4.42, 5.53, 3.44, 5.59, 5.12, 5.12, 3.26, 6.00, …
$ BPSysAve        <int> 103, 110, 104, 118, 122, 112, 112, 109, 115, 127, 120,…
$ BPDiaAve        <int> 72, 65, 73, 65, 74, 72, 72, 70, 74, 89, 77, 78, 78, 61…
$ Pulse           <int> 80, 84, 78, 60, 60, 78, 78, 90, 76, 68, 84, 84, 84, 62…
$ UrineVol1       <int> 107, 65, 83, 178, 13, 66, 66, 240, 212, 118, 57, 72, 7…
$ HHIncome        <fct> 20000-24999, more 99999, more 99999, 75000-99999, 6500…
$ HHIncomeMid     <int> 22500, 100000, 100000, 87500, 70000, 50000, 50000, 500…
$ Poverty         <dbl> 2.02, 5.00, 5.00, 5.00, 3.67, 1.85, 1.85, 1.50, 1.33, …
$ BMI_WHO         <fct> 30.0_plus, 25.0_to_29.9, 25.0_to_29.9, 25.0_to_29.9, 3…
$ AgeDecade       <fct>  40-49,  50-59,  30-39,  50-59,  40-49,  30-39,  30-39…
$ BMI             <dbl> 33.3, 28.0, 25.0, 29.9, 31.1, 32.9, 32.9, 38.0, 30.2, …
$ Height          <dbl> 172.0, 186.0, 179.0, 175.4, 167.9, 166.6, 166.6, 167.1…
$ TVHrsDay        <fct> More_4_hr, 1_hr, 2_hr, 3_hr, 3_hr, 1_hr, 1_hr, 2_hr, 2…
$ CompHrsDay      <fct> More_4_hr, 1_hr, 0_to_1_hr, 3_hr, 2_hr, More_4_hr, Mor…
$ Weight          <dbl> 98.6, 96.9, 80.1, 91.9, 87.8, 91.3, 91.3, 106.0, 96.8,…
$ HomeRooms       <int> 4, 4, 3, 6, 5, 6, 6, 6, 4, 11, 6, 7, 7, 7, 6, 7, 8, 7,…
$ HomeOwn         <fct> Rent, Rent, Rent, Own, Own, Own, Own, Rent, Own, Own, …
$ SurveyYr        <fct> 2011_12, 2011_12, 2011_12, 2011_12, 2011_12, 2011_12, …
$ Gender          <fct> female, male, male, male, male, female, female, female…
$ Age             <int> 43, 57, 32, 56, 43, 38, 38, 23, 22, 41, 51, 41, 41, 28…
$ Race1           <fct> Black, White, White, Other, Black, White, White, White…
$ Race3           <fct> Black, White, White, Other, Black, White, White, White…
$ y_hat           <dbl> 13.639121, 14.451091, 8.212610, 15.450294, 19.127222, …

\(~\)

\(~\)

23.4.1 Testing Set Confusion Matrix

RMSE_rf_TEST <- yardstick::rmse(test.rf_scored, truth=SexNumPartnLife, estimate=y_hat)

RMSE_rf_TEST
# A tibble: 1 × 3
  .metric .estimator .estimate
  <chr>   <chr>          <dbl>
1 rmse    standard        19.3