22  Random Forest Classification

\(~\)

\(~\)

\(~\)

22.1 Read in the Data

install_if_not <- function( list.of.packages ) {
  new.packages <- list.of.packages[!(list.of.packages %in% installed.packages()[,"Package"])]
  if(length(new.packages)) { install.packages(new.packages) } else { print(paste0("the package '", list.of.packages , "' is already installed")) }
}

library('tidyverse')
── Attaching core tidyverse packages ──────────────────────── tidyverse 2.0.0 ──
✔ dplyr     1.1.4     ✔ readr     2.1.5
✔ forcats   1.0.0     ✔ stringr   1.5.1
✔ ggplot2   3.5.1     ✔ tibble    3.2.1
✔ lubridate 1.9.3     ✔ tidyr     1.3.1
✔ purrr     1.0.2     
── Conflicts ────────────────────────────────────────── tidyverse_conflicts() ──
✖ dplyr::filter() masks stats::filter()
✖ dplyr::lag()    masks stats::lag()
ℹ Use the conflicted package (<http://conflicted.r-lib.org/>) to force all conflicts to become errors
library(NHANES)

NHANES_DATA_12 <- NHANES %>% 
  select(-DiabetesAge) %>%
  filter(SurveyYr =='2011_12') 

SumNa <- function(col){sum(is.na(col))}

data.sum <- NHANES_DATA_12 %>% 
  summarise_all(SumNa) %>%
  tidyr::gather(key='feature', value='SumNa') %>%
  arrange(-SumNa) %>%
  mutate(PctNa = SumNa/nrow(NHANES_DATA_12))

data.sum2 <- data.sum %>% 
  filter(! (feature %in% c('ID','Diabetes'))) %>%
  filter(PctNa < .55)

data.sum2$feature
 [1] "PhysActiveDays"  "SexOrientation"  "SexNumPartYear"  "Marijuana"      
 [5] "RegularMarij"    "AlcoholDay"      "SexAge"          "SexNumPartnLife"
 [9] "HardDrugs"       "SexEver"         "SameSex"         "AlcoholYear"    
[13] "LittleInterest"  "Depressed"       "Alcohol12PlusYr" "Education"      
[17] "MaritalStatus"   "Smoke100"        "Smoke100n"       "DaysPhysHlthBad"
[21] "DaysMentHlthBad" "HealthGen"       "SleepHrsNight"   "Work"           
[25] "SleepTrouble"    "BPSys1"          "BPDia1"          "Testosterone"   
[29] "PhysActive"      "BPSys2"         
 [ reached getOption("max.print") -- omitted 27 entries ]
data_F <- NHANES_DATA_12 %>% 
  select(ID, Diabetes, data.sum2$feature) %>%
  filter(!is.na(Diabetes)) %>%
  na.omit()

\(~\)


\(~\)

\(~\)

22.2 Split Data into Training and Test Sets.

diab_pop.no_na_vals <- data_F


library('caret')
Loading required package: lattice

Attaching package: 'caret'
The following object is masked from 'package:purrr':

    lift
# this will ensure our results are the same every run, to randomize you may use: set.seed(Sys.time())
set.seed(8675309)


# The createDataPartition function is used to create training and test sets
trainIndex <- createDataPartition(diab_pop.no_na_vals$Diabetes, 
                                  p = .6, 
                                  list = FALSE, 
                                  times = 1)

TRAIN <- diab_pop.no_na_vals[trainIndex, ]
TEST <- diab_pop.no_na_vals[-trainIndex, ]

\(~\)

\(~\)

\(~\)

22.3 Train randomForest model

install_if_not('randomForest')
[1] "the package 'randomForest' is already installed"
randomForest 4.7-1.1
Type rfNews() to see new features/changes/bug fixes.

Attaching package: 'randomForest'
The following object is masked from 'package:dplyr':

    combine
The following object is masked from 'package:ggplot2':

    margin
rf_model <- randomForest(Diabetes ~ . ,
                         data = TRAIN,
                         ntree= 550,
                         mtry=3,
                         keep.forest=TRUE,
                         importance=TRUE)
                                             
rf_model

Call:
 randomForest(formula = Diabetes ~ ., data = TRAIN, ntree = 550,      mtry = 3, keep.forest = TRUE, importance = TRUE) 
               Type of random forest: classification
                     Number of trees: 550
No. of variables tried at each split: 3

        OOB estimate of  error rate: 3.79%
Confusion matrix:
     No Yes class.error
No  375   0   0.0000000
Yes  15   6   0.7142857

\(~\)

\(~\)

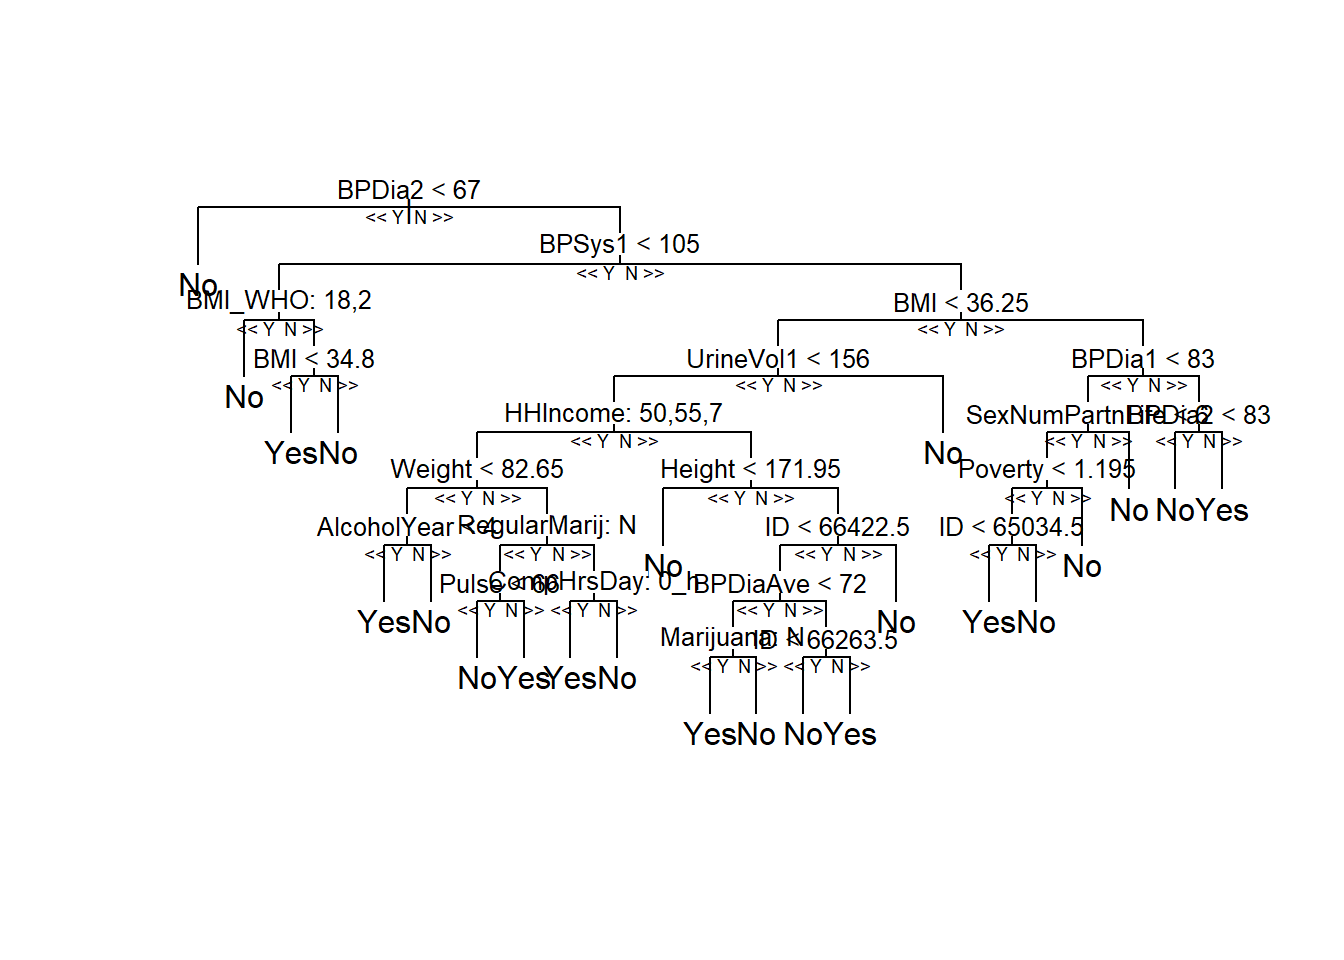
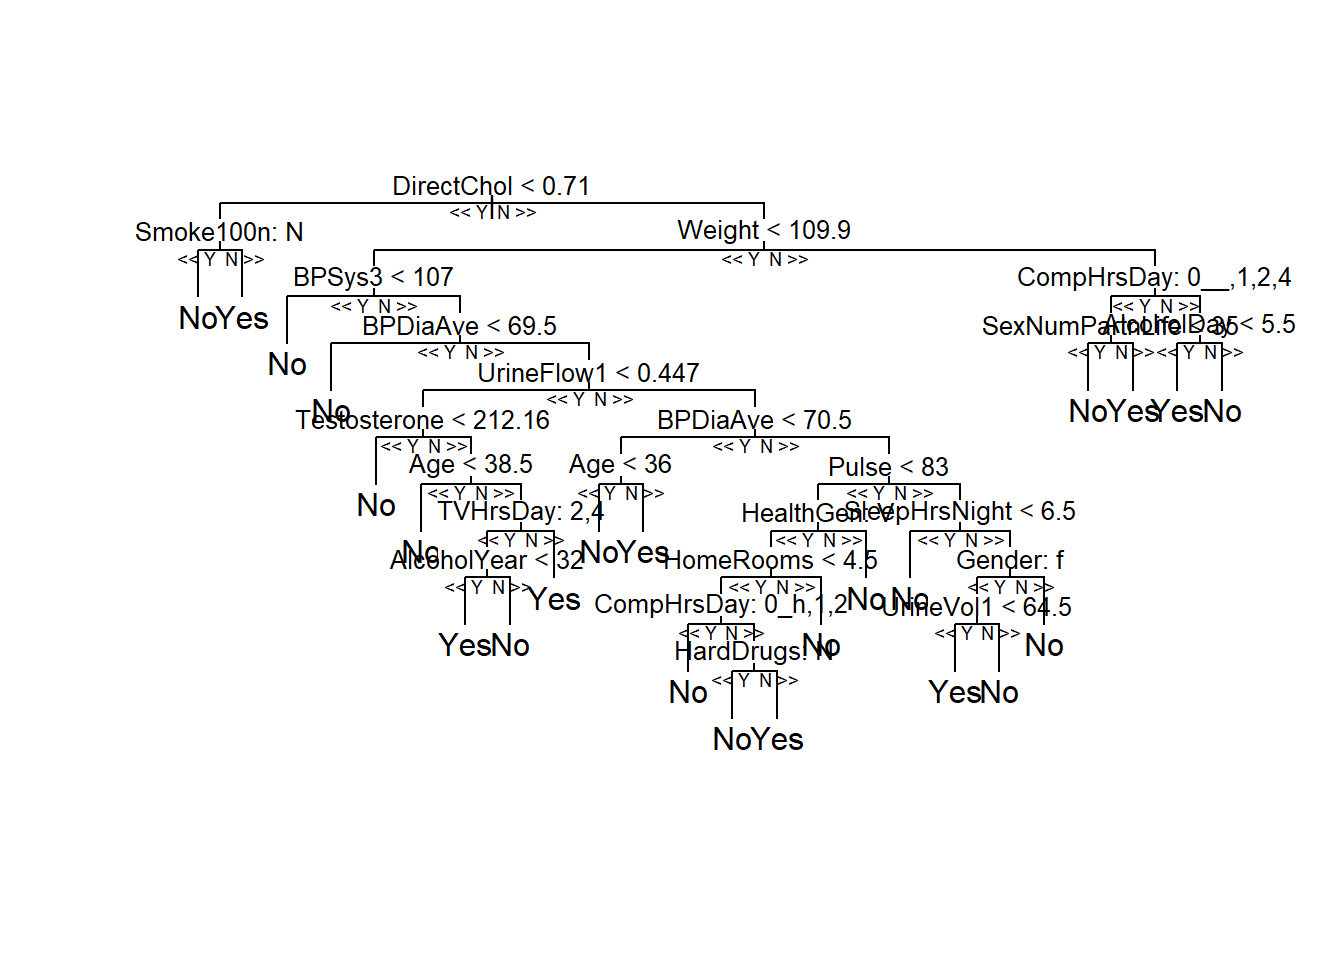
22.4 Random Forest is a Collection of Decision Trees

str(rf_model, 1)
List of 19
 $ call           : language randomForest(formula = Diabetes ~ ., data = TRAIN, ntree = 550, mtry = 3,      keep.forest = TRUE, importance = TRUE)
 $ type           : chr "classification"
 $ predicted      : Factor w/ 2 levels "No","Yes": 1 1 1 1 1 1 1 1 1 1 ...
  ..- attr(*, "names")= chr [1:396] "1" "2" "3" "4" ...
 $ err.rate       : num [1:550, 1:3] 0.0753 0.0664 0.0856 0.0661 0.0621 ...
  ..- attr(*, "dimnames")=List of 2
 $ confusion      : num [1:2, 1:3] 375 15 0 6 0 ...
  ..- attr(*, "dimnames")=List of 2
 $ votes          : 'matrix' num [1:396, 1:2] 0.898 0.933 0.924 0.985 0.911 ...
  ..- attr(*, "dimnames")=List of 2
 $ oob.times      : num [1:396] 206 209 198 202 203 185 227 194 211 192 ...
 $ classes        : chr [1:2] "No" "Yes"
 $ importance     : num [1:58, 1:4] 1.13e-03 3.12e-04 9.37e-05 3.72e-04 5.91e-04 ...
  ..- attr(*, "dimnames")=List of 2
 $ importanceSD   : num [1:58, 1:3] 3.09e-04 2.22e-04 4.45e-05 2.06e-04 1.82e-04 ...
  ..- attr(*, "dimnames")=List of 2
 $ localImportance: NULL
 $ proximity      : NULL
 $ ntree          : num 550
 $ mtry           : num 3
 $ forest         :List of 14
 $ y              : Factor w/ 2 levels "No","Yes": 1 1 1 1 1 1 1 1 1 1 ...
  ..- attr(*, "names")= chr [1:396] "1" "2" "3" "4" ...
 $ test           : NULL
 $ inbag          : NULL
 $ terms          :Classes 'terms', 'formula'  language Diabetes ~ ID + PhysActiveDays + SexOrientation + SexNumPartYear + Marijuana +      RegularMarij + AlcoholDay + S| __truncated__ ...
  .. ..- attr(*, "variables")= language list(Diabetes, ID, PhysActiveDays, SexOrientation, SexNumPartYear, Marijuana,      RegularMarij, AlcoholDay, SexA| __truncated__ ...
  .. ..- attr(*, "factors")= int [1:59, 1:58] 0 1 0 0 0 0 0 0 0 0 ...
  .. .. ..- attr(*, "dimnames")=List of 2
  .. ..- attr(*, "term.labels")= chr [1:58] "ID" "PhysActiveDays" "SexOrientation" "SexNumPartYear" ...
  .. ..- attr(*, "order")= int [1:58] 1 1 1 1 1 1 1 1 1 1 ...
  .. ..- attr(*, "intercept")= num 0
  .. ..- attr(*, "response")= int 1
  .. ..- attr(*, ".Environment")=<environment: R_GlobalEnv> 
  .. ..- attr(*, "predvars")= language list(Diabetes, ID, PhysActiveDays, SexOrientation, SexNumPartYear, Marijuana,      RegularMarij, AlcoholDay, SexA| __truncated__ ...
  .. ..- attr(*, "dataClasses")= Named chr [1:59] "factor" "numeric" "numeric" "factor" ...
  .. .. ..- attr(*, "names")= chr [1:59] "Diabetes" "ID" "PhysActiveDays" "SexOrientation" ...
 - attr(*, "class")= chr [1:2] "randomForest.formula" "randomForest"
#install.packages('devtools')
getTree(rf_model, 1)
   left daughter right daughter split var split point status prediction
1              2              3        51     80.6500      1          0
2              4              5        35     77.0000      1          0
3              6              7        53      3.0000      1          0
4              0              0         0      0.0000     -1          1
5              8              9        45      2.0000      1          0
 [ reached getOption("max.print") -- omitted 50 rows ]
#devtools::install_github('araastat/reprtree')

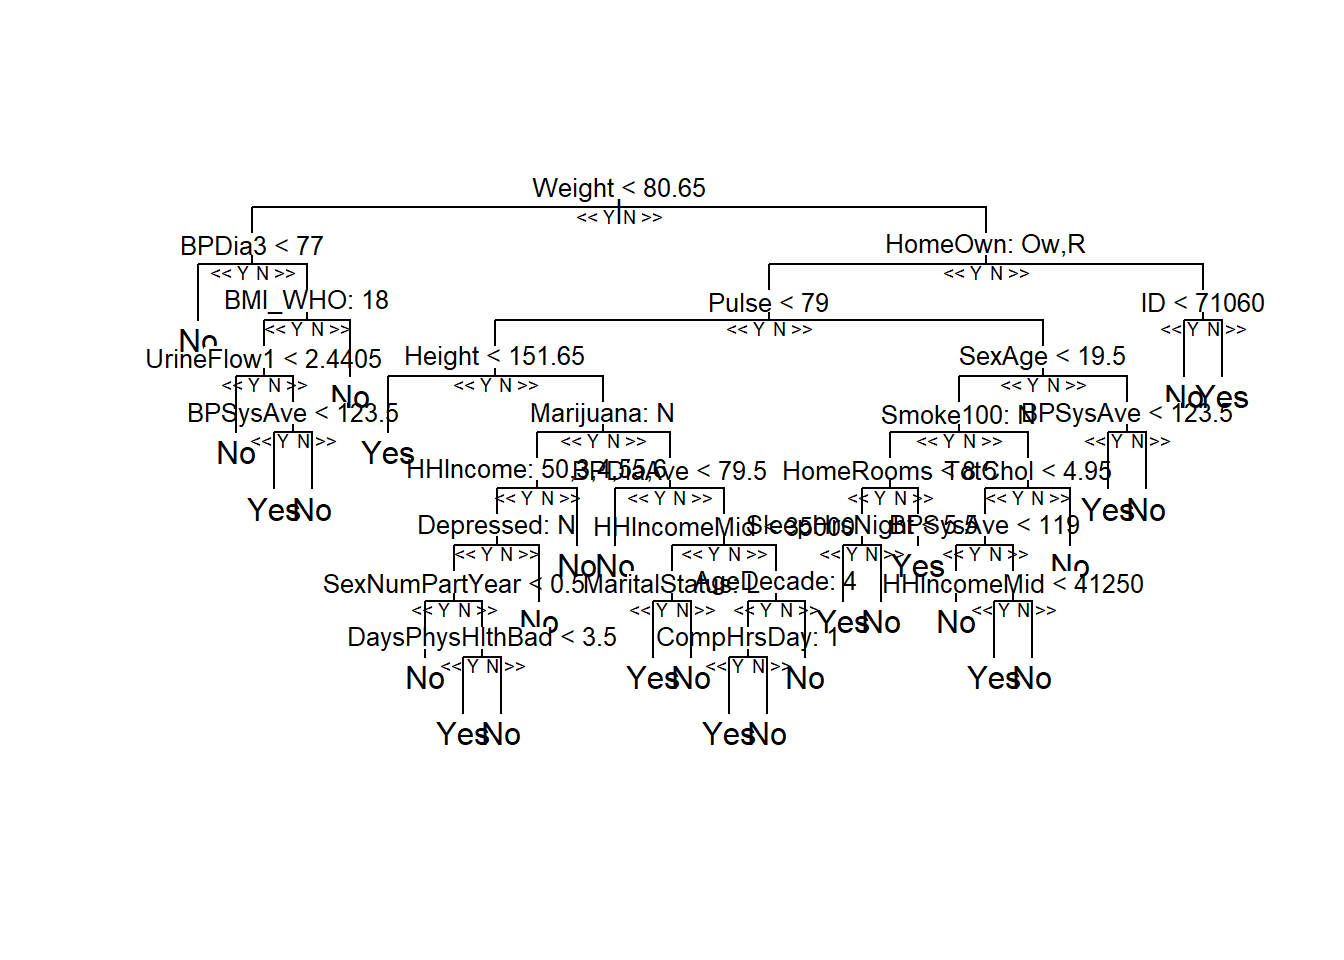
reprtree:::plot.getTree(rf_model,k=1)
Registered S3 method overwritten by 'reprtree':
  method    from
  text.tree tree
Loading required package: plotrix

reprtree:::plot.getTree(rf_model,k=4)

reprtree:::plot.getTree(rf_model,k=500)

\(~\)

\(~\)

22.5 Feature Importances

varImp(rf_model)
                       No       Yes
ID              4.5823455 4.5823455
PhysActiveDays  1.2346255 1.2346255
SexOrientation  1.0530574 1.0530574
SexNumPartYear  2.2774684 2.2774684
Marijuana       2.0911408 2.0911408
RegularMarij    2.5064911 2.5064911
AlcoholDay      3.2571270 3.2571270
SexAge          5.5212276 5.5212276
SexNumPartnLife 5.9175652 5.9175652
HardDrugs       1.9738315 1.9738315
SexEver         0.0000000 0.0000000
SameSex         0.4081805 0.4081805
AlcoholYear     2.7465340 2.7465340
LittleInterest  1.3916048 1.3916048
Depressed       1.6754282 1.6754282
 [ reached 'max' / getOption("max.print") -- omitted 43 rows ]
importance(rf_model)
                         No       Yes MeanDecreaseAccuracy MeanDecreaseGini
ID               3.65127494 5.5134162            5.1444615      0.987404629
PhysActiveDays   1.40564236 1.0636087            1.5079639      0.546625122
SexOrientation   2.10611472 0.0000000            2.1171864      0.015141827
SexNumPartYear   1.80075617 2.7541806            2.7488142      0.438879163
Marijuana        3.24324918 0.9390324            3.1350646      0.212959914
RegularMarij     2.08238017 2.9306021            2.7842770      0.182168098
AlcoholDay       1.91503170 4.5992223            3.4667279      0.781378710
 [ reached getOption("max.print") -- omitted 51 rows ]
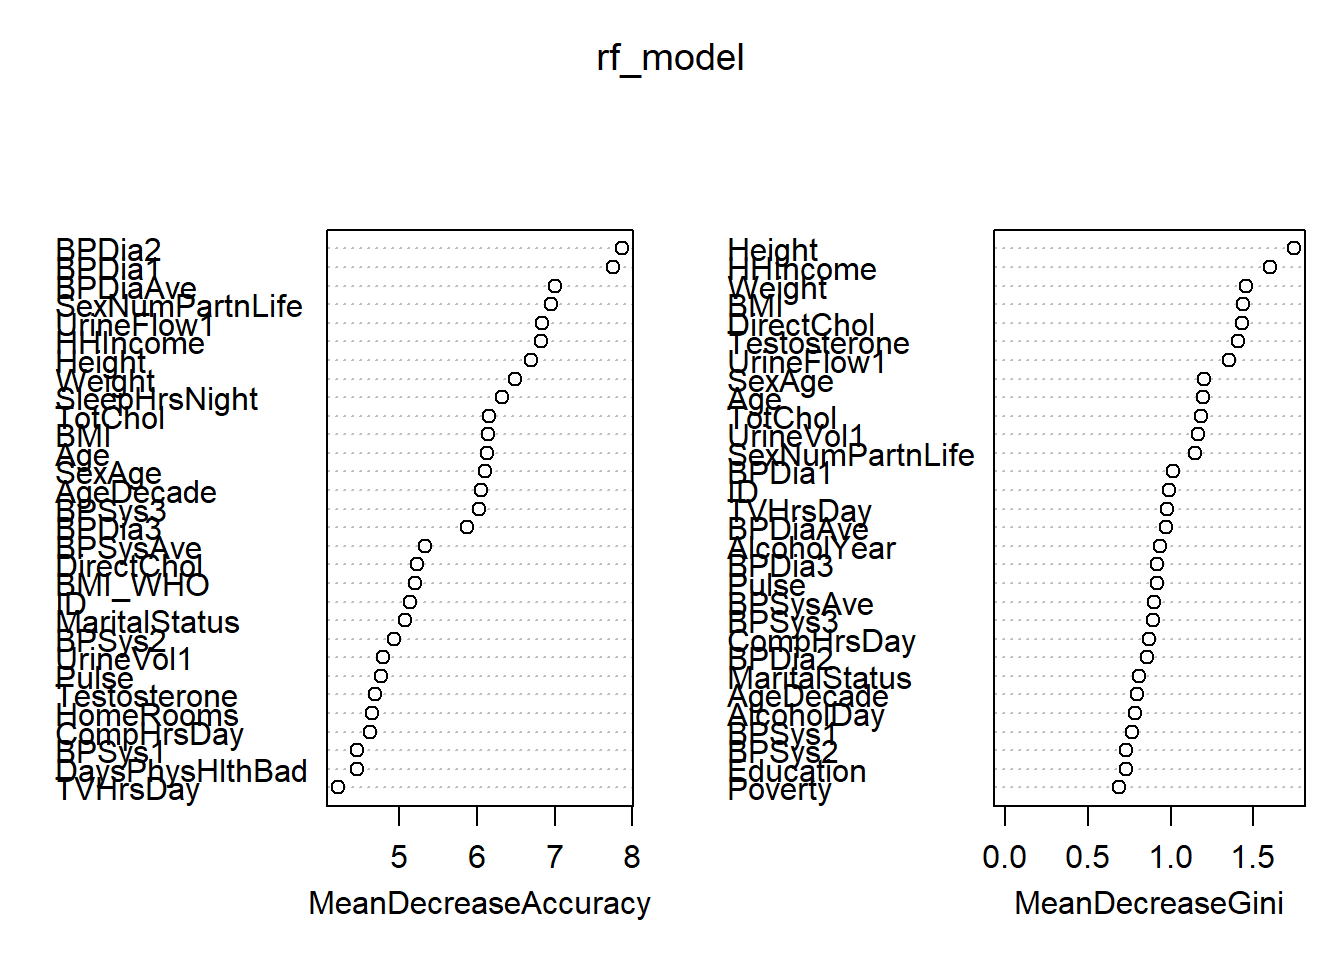
varImpPlot(rf_model)

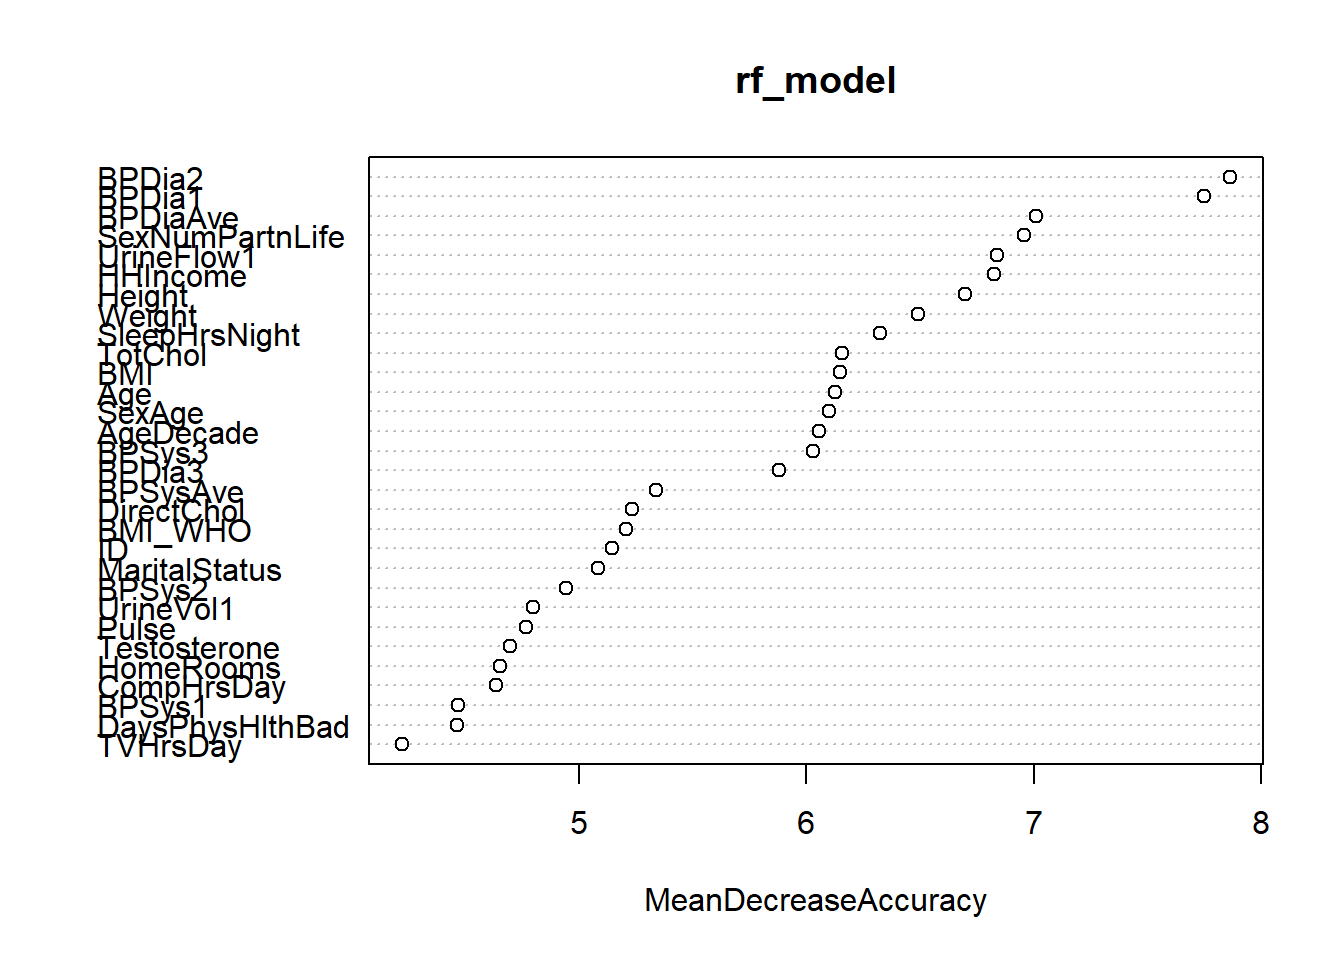
varImpPlot(rf_model, type=1)

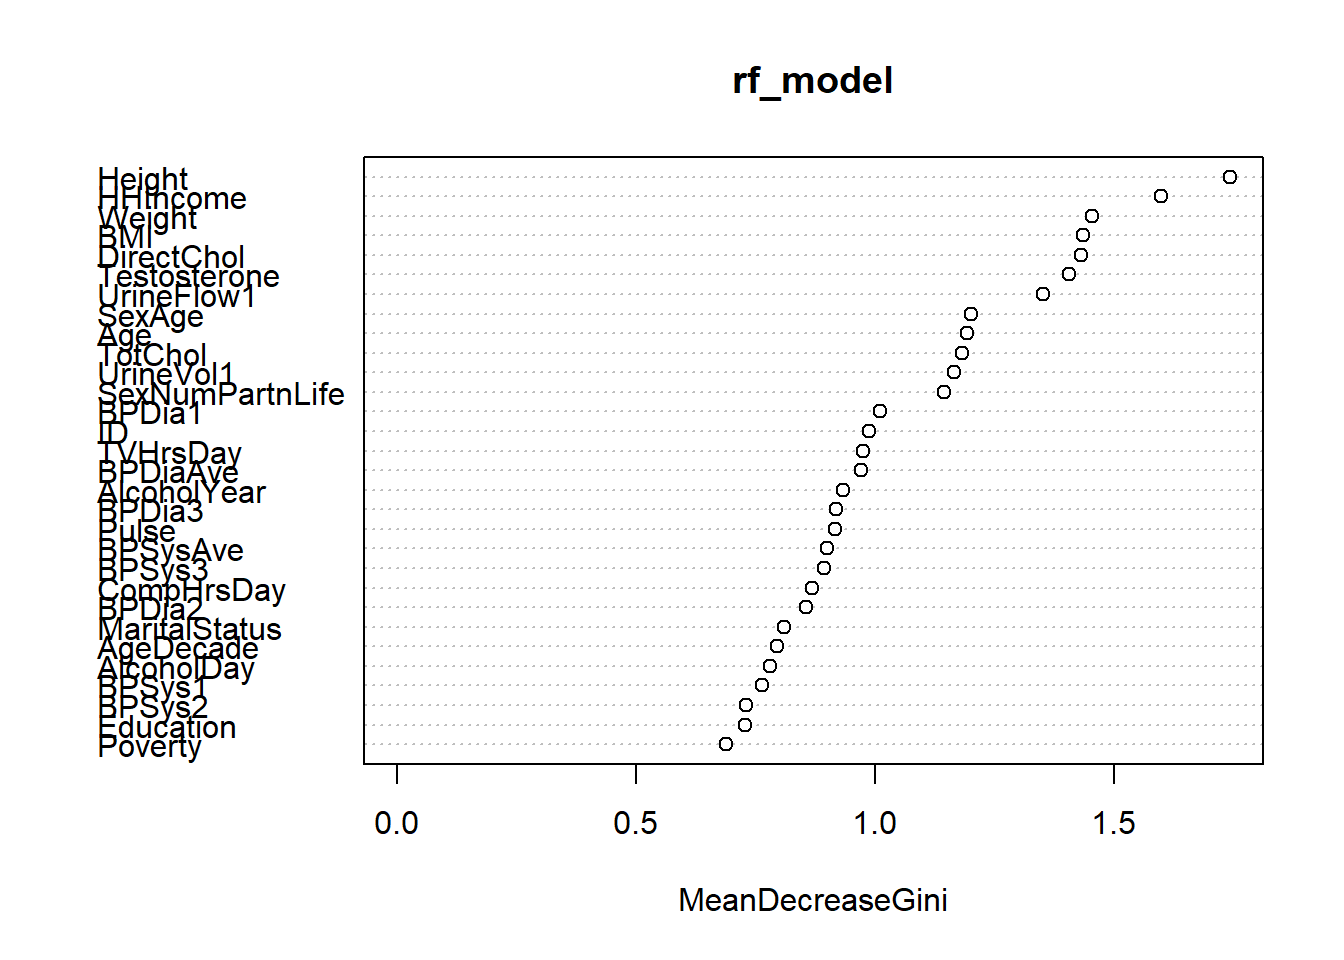
varImpPlot(rf_model, type=2)

\(~\)

\(~\)

22.5.1 Score Training Set

probs <- predict(rf_model, TRAIN, type ="prob")

class <- predict(rf_model, TRAIN, type ="class")

TRAIN.rf_scored <- as_tibble(cbind(TRAIN, probs, class))
glimpse(TRAIN.rf_scored)
Rows: 396
Columns: 62
$ ID              <int> 62199, 62205, 62220, 62222, 62291, 62297, 62340, 62340…
$ Diabetes        <fct> No, No, No, No, No, No, No, No, No, No, No, No, No, No…
$ PhysActiveDays  <int> 2, 1, 3, 2, 7, 3, 3, 3, 2, 7, 1, 2, 5, 7, 7, 3, 5, 7, …
$ SexOrientation  <fct> Homosexual, Heterosexual, Heterosexual, Heterosexual, …
$ SexNumPartYear  <int> 0, 1, 1, 1, 1, 1, 1, 1, 1, 1, 1, 1, 2, 1, 1, 0, 0, 1, …
$ Marijuana       <fct> Yes, Yes, No, No, No, Yes, No, No, No, No, No, Yes, Ye…
$ RegularMarij    <fct> No, No, No, No, No, No, No, No, No, No, No, Yes, No, N…
$ AlcoholDay      <int> 1, 3, 3, 2, 3, 4, 1, 1, 2, 2, 2, 4, 7, 6, 1, 2, 1, 1, …
$ SexAge          <int> 19, 14, 18, 20, 20, 22, 19, 19, 19, 19, 19, 16, 18, 17…
$ SexNumPartnLife <int> 6, 4, 20, 1, 3, 25, 5, 5, 3, 3, 1, 15, 8, 3, 4, 1, 5, …
$ HardDrugs       <fct> Yes, No, No, No, No, Yes, No, No, No, No, No, Yes, Yes…
$ SexEver         <fct> Yes, Yes, Yes, Yes, Yes, Yes, Yes, Yes, Yes, Yes, Yes,…
$ SameSex         <fct> Yes, No, No, No, No, No, No, No, No, No, Yes, No, Yes,…
$ AlcoholYear     <int> 260, 52, 36, 52, 3, 156, 12, 12, 36, 36, 2, 104, 260, …
$ LittleInterest  <fct> None, None, None, None, Several, Most, Most, Most, Non…
$ Depressed       <fct> None, None, Several, None, None, None, Most, Most, Non…
$ Alcohol12PlusYr <fct> Yes, Yes, Yes, Yes, Yes, Yes, Yes, Yes, Yes, Yes, Yes,…
$ Education       <fct> College Grad, College Grad, College Grad, College Grad…
$ MaritalStatus   <fct> LivePartner, NeverMarried, NeverMarried, Married, Marr…
$ Smoke100        <fct> Yes, No, No, No, No, Yes, No, No, No, No, No, Yes, Yes…
$ Smoke100n       <fct> Smoker, Non-Smoker, Non-Smoker, Non-Smoker, Non-Smoker…
$ DaysPhysHlthBad <int> 0, 0, 0, 0, 21, 0, 0, 0, 0, 0, 20, 0, 0, 0, 0, 0, 0, 0…
$ DaysMentHlthBad <int> 1, 0, 3, 0, 0, 0, 26, 26, 0, 0, 7, 10, 3, 0, 10, 4, 0,…
$ HealthGen       <fct> Vgood, Good, Good, Good, Fair, Vgood, Vgood, Vgood, Go…
$ SleepHrsNight   <int> 8, 6, 6, 7, 7, 7, 6, 6, 6, 6, 8, 6, 8, 9, 7, 8, 7, 8, …
$ Work            <fct> Working, Working, Working, Working, Working, Working, …
$ SleepTrouble    <fct> No, Yes, Yes, Yes, Yes, No, No, No, Yes, Yes, No, No, …
$ BPSys1          <int> 112, 116, 118, 106, 122, 126, 106, 106, 126, 126, 116,…
$ BPDia1          <int> 70, 86, 70, 76, 70, 76, 80, 80, 84, 84, 68, 66, 80, 80…
$ Testosterone    <dbl> 269.24, 466.11, 35.95, 343.14, 257.94, 619.40, 296.66,…
$ PhysActive      <fct> Yes, Yes, Yes, No, Yes, Yes, No, No, Yes, Yes, Yes, Ye…
$ BPSys2          <int> 108, 122, 122, 108, 120, 122, 106, 106, 114, 114, 106,…
$ BPDia2          <int> 64, 88, 72, 70, 68, 72, 82, 82, 74, 74, 70, 64, 84, 78…
$ UrineFlow1      <dbl> 0.380, 0.355, 0.624, 1.297, 0.809, 0.448, 0.623, 0.623…
$ BPSys3          <int> 112, 122, 118, 100, 116, 122, 106, 106, 110, 110, 112,…
$ BPDia3          <int> 66, 86, 70, 76, 62, 76, 80, 80, 70, 70, 70, 70, 80, 70…
$ DirectChol      <dbl> 0.91, 1.03, 1.37, 1.32, 1.11, 1.55, 0.98, 0.98, 1.27, …
$ TotChol         <dbl> 4.42, 5.46, 5.09, 5.53, 3.44, 5.59, 4.16, 4.16, 5.12, …
$ BPSysAve        <int> 110, 122, 120, 104, 118, 122, 106, 106, 112, 112, 109,…
$ BPDiaAve        <int> 65, 87, 71, 73, 65, 74, 81, 81, 72, 72, 70, 67, 82, 74…
$ Pulse           <int> 84, 70, 62, 78, 60, 60, 68, 68, 78, 78, 90, 70, 80, 76…
$ UrineVol1       <int> 65, 22, 121, 83, 178, 13, 96, 96, 66, 66, 240, 44, 193…
$ HHIncome        <fct> more 99999, more 99999, 55000-64999, more 99999, 75000…
$ HHIncomeMid     <int> 100000, 100000, 60000, 100000, 87500, 70000, 30000, 30…
$ Poverty         <dbl> 5.00, 5.00, 4.92, 5.00, 5.00, 3.67, 1.28, 1.28, 1.85, …
$ BMI_WHO         <fct> 25.0_to_29.9, 25.0_to_29.9, 30.0_plus, 25.0_to_29.9, 2…
$ AgeDecade       <fct>  50-59,  20-29,  30-39,  30-39,  50-59,  40-49,  40-49…
$ BMI             <dbl> 28.0, 28.9, 40.4, 25.0, 29.9, 31.1, 25.9, 25.9, 32.9, …
$ Height          <dbl> 186.0, 171.4, 167.3, 179.0, 175.4, 167.9, 173.2, 173.2…
$ TVHrsDay        <fct> 1_hr, 1_hr, 2_hr, 2_hr, 3_hr, 3_hr, 3_hr, 3_hr, 1_hr, …
$ CompHrsDay      <fct> 1_hr, 3_hr, 1_hr, 0_to_1_hr, 3_hr, 2_hr, 1_hr, 1_hr, M…
$ Weight          <dbl> 96.9, 84.8, 113.1, 80.1, 91.9, 87.8, 77.6, 77.6, 91.3,…
$ HomeRooms       <int> 4, 12, 4, 3, 6, 5, 6, 6, 6, 6, 6, 5, 9, 4, 9, 6, 6, 7,…
$ HomeOwn         <fct> Rent, Own, Own, Rent, Own, Own, Own, Own, Own, Own, Re…
$ SurveyYr        <fct> 2011_12, 2011_12, 2011_12, 2011_12, 2011_12, 2011_12, …
$ Gender          <fct> male, male, female, male, male, male, male, male, fema…
$ Age             <int> 57, 28, 31, 32, 56, 43, 44, 44, 38, 38, 23, 43, 36, 22…
$ Race1           <fct> White, White, Black, White, Other, Black, White, White…
$ Race3           <fct> White, White, Black, White, Other, Black, White, White…
$ No              <dbl> 0.9618182, 0.9745455, 0.9727273, 0.9945455, 0.9672727,…
$ Yes             <dbl> 0.038181818, 0.025454545, 0.027272727, 0.005454545, 0.…
$ class           <fct> No, No, No, No, No, No, No, No, No, No, No, No, No, No…
\(~\)

\(~\)

22.5.1.1 Confusion Matrix on Training Set

train_conf_mat <- yardstick::conf_mat(TRAIN.rf_scored, truth=Diabetes, estimate=class)

train_conf_mat
          Truth
Prediction  No Yes
       No  375   0
       Yes   0  21
summary(train_conf_mat)
# A tibble: 13 × 3
   .metric              .estimator .estimate
   <chr>                <chr>          <dbl>
 1 accuracy             binary         1    
 2 kap                  binary         1    
 3 sens                 binary         1    
 4 spec                 binary         1    
 5 ppv                  binary         1    
 6 npv                  binary         1    
 7 mcc                  binary         1    
 8 j_index              binary         1    
 9 bal_accuracy         binary         1    
10 detection_prevalence binary         0.947
11 precision            binary         1    
12 recall               binary         1    
13 f_meas               binary         1    

\(~\)

\(~\)


\(~\)

\(~\)

22.6 Score Test Set

probs <- predict(rf_model, TEST, type ="prob")
class <- predict(rf_model, TEST, type ="class")

#predict(diab_pop.no_na_vals.train.rf_model, diab_pop.no_na_vals.test, type ="prob")

test.rf_scored <- as_tibble(cbind(TEST, probs, class))

glimpse(test.rf_scored)
Rows: 264
Columns: 62
$ ID              <int> 62172, 62199, 62231, 62340, 62444, 62460, 62481, 62552…
$ Diabetes        <fct> No, No, No, No, No, No, No, No, No, No, No, No, No, No…
$ PhysActiveDays  <int> 2, 7, 3, 5, 6, 3, 3, 7, 1, 1, 2, 1, 7, 3, 5, 4, 3, 3, …
$ SexOrientation  <fct> Heterosexual, Homosexual, Heterosexual, Heterosexual, …
$ SexNumPartYear  <int> 2, 0, 1, 1, 2, 1, 2, 1, 1, 2, 2, 10, 1, 1, 0, 1, 1, 1,…
$ Marijuana       <fct> Yes, Yes, No, No, Yes, Yes, No, Yes, No, No, No, Yes, …
$ RegularMarij    <fct> No, No, No, No, No, No, No, No, No, No, No, Yes, No, Y…
$ AlcoholDay      <int> 3, 1, 2, 1, 4, 3, 2, 1, 1, 6, 6, 15, 1, 2, 1, 1, 1, 2,…
$ SexAge          <int> 17, 19, 14, 19, 17, 16, 20, 16, 24, 17, 17, 17, 18, 14…
$ SexNumPartnLife <int> 4, 6, 1, 5, 3, 50, 25, 10, 7, 7, 7, 300, 4, 5, 5, 1, 1…
$ HardDrugs       <fct> No, Yes, No, No, No, Yes, No, No, No, No, No, Yes, No,…
$ SexEver         <fct> Yes, Yes, Yes, Yes, Yes, Yes, Yes, Yes, Yes, Yes, Yes,…
$ SameSex         <fct> No, Yes, No, No, No, No, No, No, No, No, No, No, No, N…
$ AlcoholYear     <int> 104, 260, 3, 12, 52, 104, 6, 300, 24, 52, 52, 104, 52,…
$ LittleInterest  <fct> Several, None, None, Most, None, Several, None, None, …
$ Depressed       <fct> Most, None, None, Most, None, Several, None, None, Non…
$ Alcohol12PlusYr <fct> Yes, Yes, Yes, Yes, Yes, Yes, Yes, Yes, Yes, Yes, Yes,…
$ Education       <fct> High School, College Grad, High School, Some College, …
$ MaritalStatus   <fct> NeverMarried, LivePartner, Married, Married, NeverMarr…
$ Smoke100        <fct> Yes, Yes, No, No, No, Yes, No, Yes, No, Yes, Yes, Yes,…
$ Smoke100n       <fct> Smoker, Smoker, Non-Smoker, Non-Smoker, Non-Smoker, Sm…
$ DaysPhysHlthBad <int> 2, 0, 0, 0, 0, 0, 2, 0, 0, 1, 1, 7, 0, 2, 0, 0, 0, 0, …
$ DaysMentHlthBad <int> 10, 1, 0, 26, 0, 3, 30, 5, 0, 0, 0, 14, 0, 2, 0, 0, 0,…
$ HealthGen       <fct> Good, Vgood, Good, Vgood, Fair, Good, Vgood, Vgood, Ex…
$ SleepHrsNight   <int> 8, 8, 4, 6, 5, 6, 6, 8, 7, 6, 6, 6, 8, 6, 9, 7, 7, 6, …
$ Work            <fct> NotWorking, Working, Working, Working, Working, Workin…
$ SleepTrouble    <fct> No, No, No, No, No, Yes, No, No, No, No, No, Yes, No, …
$ BPSys1          <int> 100, 112, 120, 106, 112, 120, 98, 118, 102, 132, 132, …
$ BPDia1          <int> 70, 70, 70, 80, 54, 90, 56, 76, 62, 70, 70, 86, 76, 58…
$ Testosterone    <dbl> 47.53, 269.24, 14.90, 296.66, 19.76, 299.19, 48.93, 18…
$ PhysActive      <fct> No, Yes, No, No, Yes, Yes, No, Yes, Yes, Yes, Yes, Yes…
$ BPSys2          <int> 102, 108, 116, 106, 116, 124, 96, 108, 100, 124, 124, …
$ BPDia2          <int> 68, 64, 70, 82, 54, 88, 62, 80, 68, 66, 66, 72, 74, 62…
$ UrineFlow1      <dbl> 0.645, 0.380, 0.196, 0.623, 0.356, 0.498, 1.300, 1.500…
$ BPSys3          <int> 104, 112, 112, 106, 112, 130, 94, 120, 102, 126, 126, …
$ BPDia3          <int> 76, 66, 68, 80, 56, 90, 54, 76, 60, 70, 70, 70, 76, 60…
$ DirectChol      <dbl> 1.89, 0.91, 1.53, 0.98, 1.16, 1.37, 1.19, 1.81, 1.47, …
$ TotChol         <dbl> 4.37, 4.42, 4.71, 4.16, 4.34, 4.65, 3.83, 4.89, 4.34, …
$ BPSysAve        <int> 103, 110, 114, 106, 114, 127, 95, 114, 101, 125, 125, …
$ BPDiaAve        <int> 72, 65, 69, 81, 55, 89, 58, 78, 64, 68, 68, 71, 75, 61…
$ Pulse           <int> 80, 84, 64, 68, 68, 68, 78, 84, 72, 80, 80, 78, 58, 60…
$ UrineVol1       <int> 107, 65, 19, 96, 26, 118, 282, 72, 276, 106, 106, 91, …
$ HHIncome        <fct> 20000-24999, more 99999, more 99999, 25000-34999,  0-4…
$ HHIncomeMid     <int> 22500, 100000, 100000, 30000, 2500, 100000, 70000, 100…
$ Poverty         <dbl> 2.02, 5.00, 3.92, 1.28, 0.00, 4.34, 3.13, 4.07, 3.06, …
$ BMI_WHO         <fct> 30.0_plus, 25.0_to_29.9, 30.0_plus, 25.0_to_29.9, 30.0…
$ AgeDecade       <fct>  40-49,  50-59,  40-49,  40-49,  20-29,  40-49,  30-39…
$ BMI             <dbl> 33.3, 28.0, 33.2, 25.9, 33.6, 21.9, 27.7, 22.5, 27.8, …
$ Height          <dbl> 172.0, 186.0, 164.7, 173.2, 169.3, 188.1, 170.5, 160.8…
$ TVHrsDay        <fct> More_4_hr, 1_hr, 2_hr, 3_hr, 4_hr, 1_hr, 1_hr, 2_hr, 0…
$ CompHrsDay      <fct> More_4_hr, 1_hr, 0_to_1_hr, 1_hr, 1_hr, 0_to_1_hr, 3_h…
$ Weight          <dbl> 98.6, 96.9, 90.1, 77.6, 96.4, 77.5, 80.5, 58.2, 87.2, …
$ HomeRooms       <int> 4, 4, 6, 6, 5, 11, 5, 7, 10, 1, 1, 8, 8, 13, 5, 8, 8, …
$ HomeOwn         <fct> Rent, Rent, Own, Own, Own, Own, Rent, Own, Own, Rent, …
$ SurveyYr        <fct> 2011_12, 2011_12, 2011_12, 2011_12, 2011_12, 2011_12, …
$ Gender          <fct> female, male, female, male, female, male, female, fema…
$ Age             <int> 43, 57, 48, 44, 23, 41, 39, 41, 32, 21, 21, 35, 57, 29…
$ Race1           <fct> Black, White, Mexican, White, Black, White, Hispanic, …
$ Race3           <fct> Black, White, Mexican, White, Black, White, Hispanic, …
$ No              <dbl> 0.9145455, 0.9545455, 0.9072727, 0.9818182, 0.9327273,…
$ Yes             <dbl> 0.08545455, 0.04545455, 0.09272727, 0.01818182, 0.0672…
$ class           <fct> No, No, No, No, No, No, No, No, No, No, No, No, No, No…
\(~\)

\(~\)

22.7 Testing Set Confusion Matrix

test_conf_mat <- yardstick::conf_mat(test.rf_scored, truth=Diabetes, estimate=class)

test_conf_mat
          Truth
Prediction  No Yes
       No  250   8
       Yes   0   6

\(~\)

\(~\)

22.7.0.1 Compare Training Confusion Matrix to Test Confusion Matrix

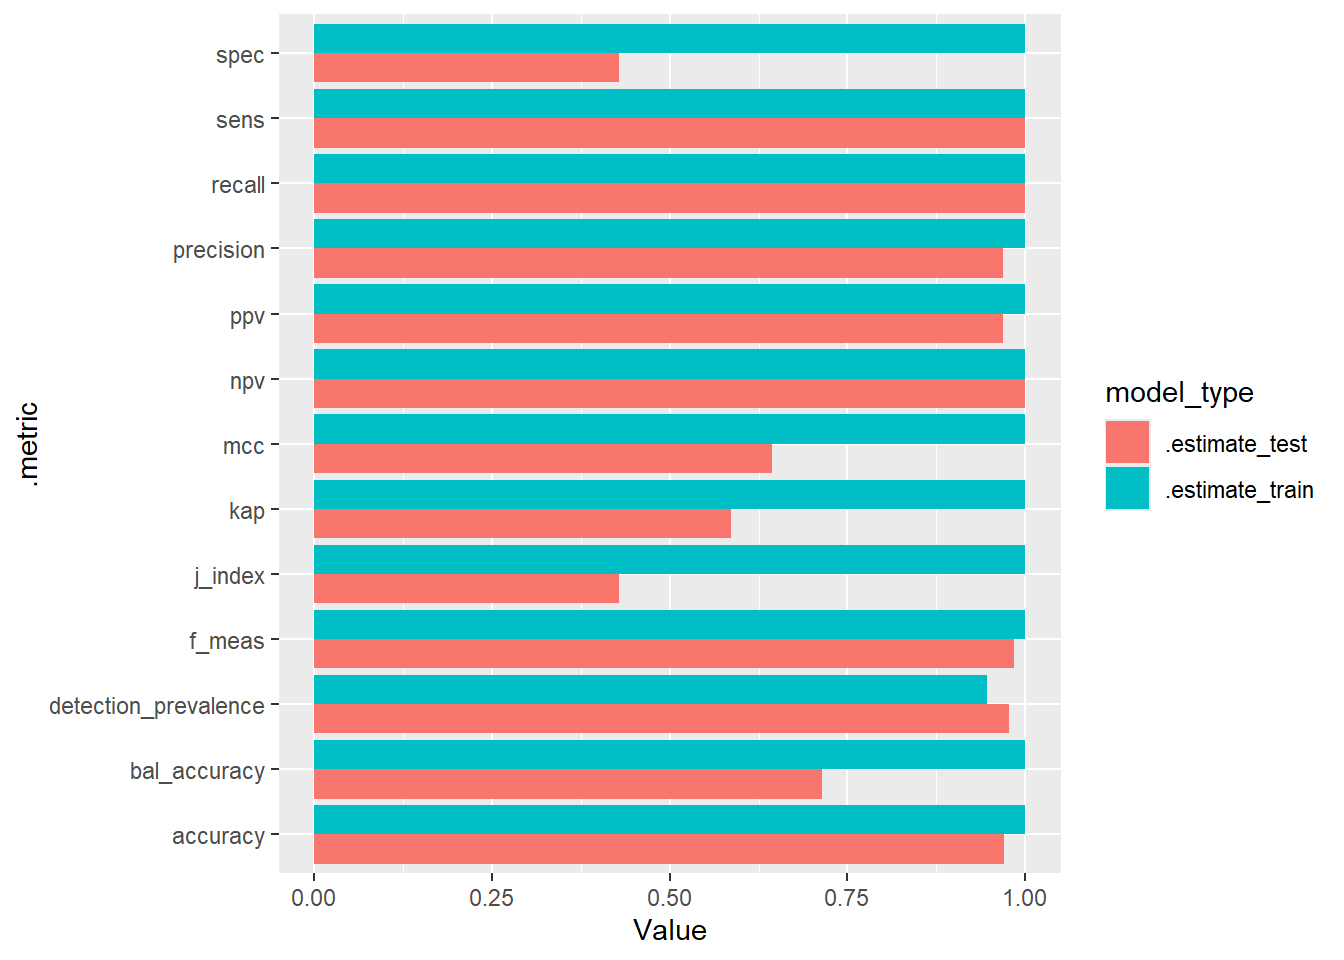
stats_train_test <- summary(train_conf_mat) %>%
  left_join( summary(test_conf_mat), 
             by=c('.metric','.estimator'), 
             suffix=c('_train','_test')) %>%
  gather(-.metric,-.estimator,key="model_type",value="Value")
  
  
library('ggplot2')

ggplot(stats_train_test, aes(x=.metric, y=Value, fill=model_type)) + 
  geom_bar(stat="identity", position=position_dodge()) +
  coord_flip() 


Attaching package: 'yardstick'
The following objects are masked from 'package:caret':

    precision, recall, sensitivity, specificity
The following object is masked from 'package:readr':

    spec
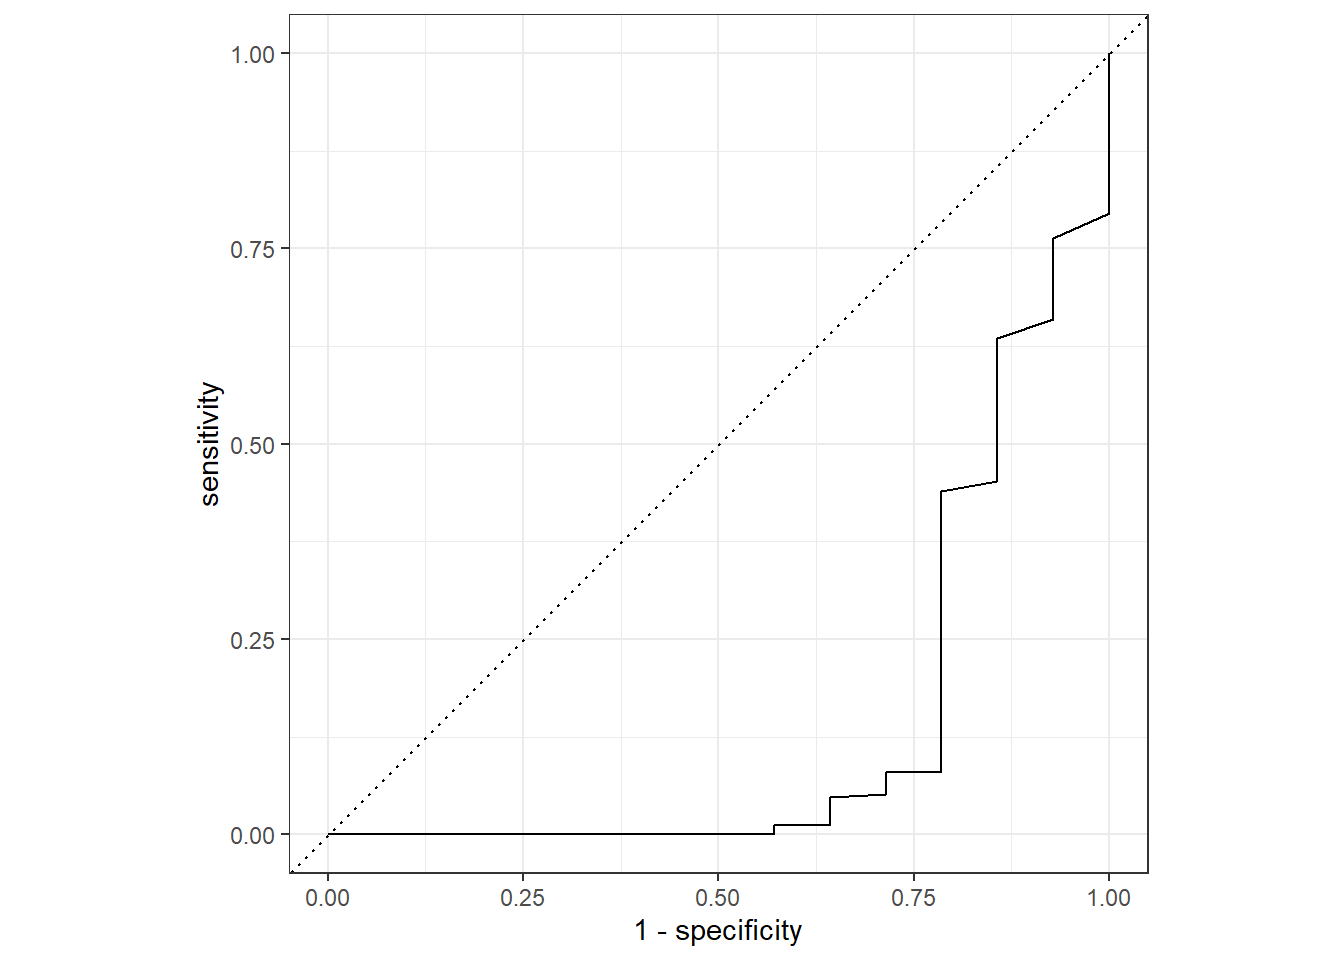
roc_auc(test.rf_scored, truth=Diabetes, Yes)$.estimate  
[1] 0.144
roc_curve(test.rf_scored,  truth=Diabetes, Yes) %>% 
  autoplot()