Attaching package: 'dplyr'The following objects are masked from 'package:stats':
filter, lagThe following objects are masked from 'package:base':
intersect, setdiff, setequal, union
Attaching package: 'dplyr'The following objects are masked from 'package:stats':
filter, lagThe following objects are masked from 'package:base':
intersect, setdiff, setequal, unionboots <- bootstraps(dt, times = 5)
list_nums <- 1:5
X_boot_analysis <- map(list_nums, \(y){
(boots %>%
mutate(id_num = stringr::str_remove(id, "Bootstrap")) %>%
mutate(id_num = as.numeric(id_num)) %>%
filter(id_num == y))$splits[[1]] %>%
analysis() %>%
mutate(boot_id = y) %>%
mutate(data_type = 'analysis')
}) %>%
list_rbind()
X_boot_assessment <- map(list_nums, \(y){
(boots %>%
mutate(id_num = stringr::str_remove(id, "Bootstrap")) %>%
mutate(id_num = as.numeric(id_num)) %>%
filter(id_num == y))$splits[[1]] %>%
assessment() %>%
mutate(boot_id = y) %>%
mutate(data_type = 'assessment')
}) %>%
list_rbind()
X_boot <- rbind(X_boot_analysis, X_boot_assessment) %>%
mutate(data_type = case_when(
data_type == "analysis" ~ "Train",
data_type == "assessment" ~ "Test"
)) %>%
mutate(data_type = factor(data_type, levels = c("Train", "Test")))
sum_X_boot <- X_boot %>%
group_by(x, boot_id, data_type) %>%
summarise(N = n(), .groups = 'keep') %>%
ungroup()
X_boot %>%
left_join(sum_X_boot, by = join_by(x, boot_id, data_type)) %>%
mutate(N = as.factor(N)) %>%
ggplot(aes(x = x,
y = boot_id,
color=as.factor(x),
size = N,
shape = N)) +
geom_point() +
scale_size_manual(values=c(2, 4, 6)) +
scale_x_continuous(breaks = 1:10, labels = as.character(1:10)) +
labs(title="Bootstap Resampling",
subtitle="5 bootstraps",
y="Bootstap Number",
color = "x") +
facet_wrap(.~data_type) +
theme(panel.border = element_rect(colour = "black", fill=NA, size=1))Warning: The `size` argument of `element_rect()` is deprecated as of ggplot2 3.4.0.
ℹ Please use the `linewidth` argument instead.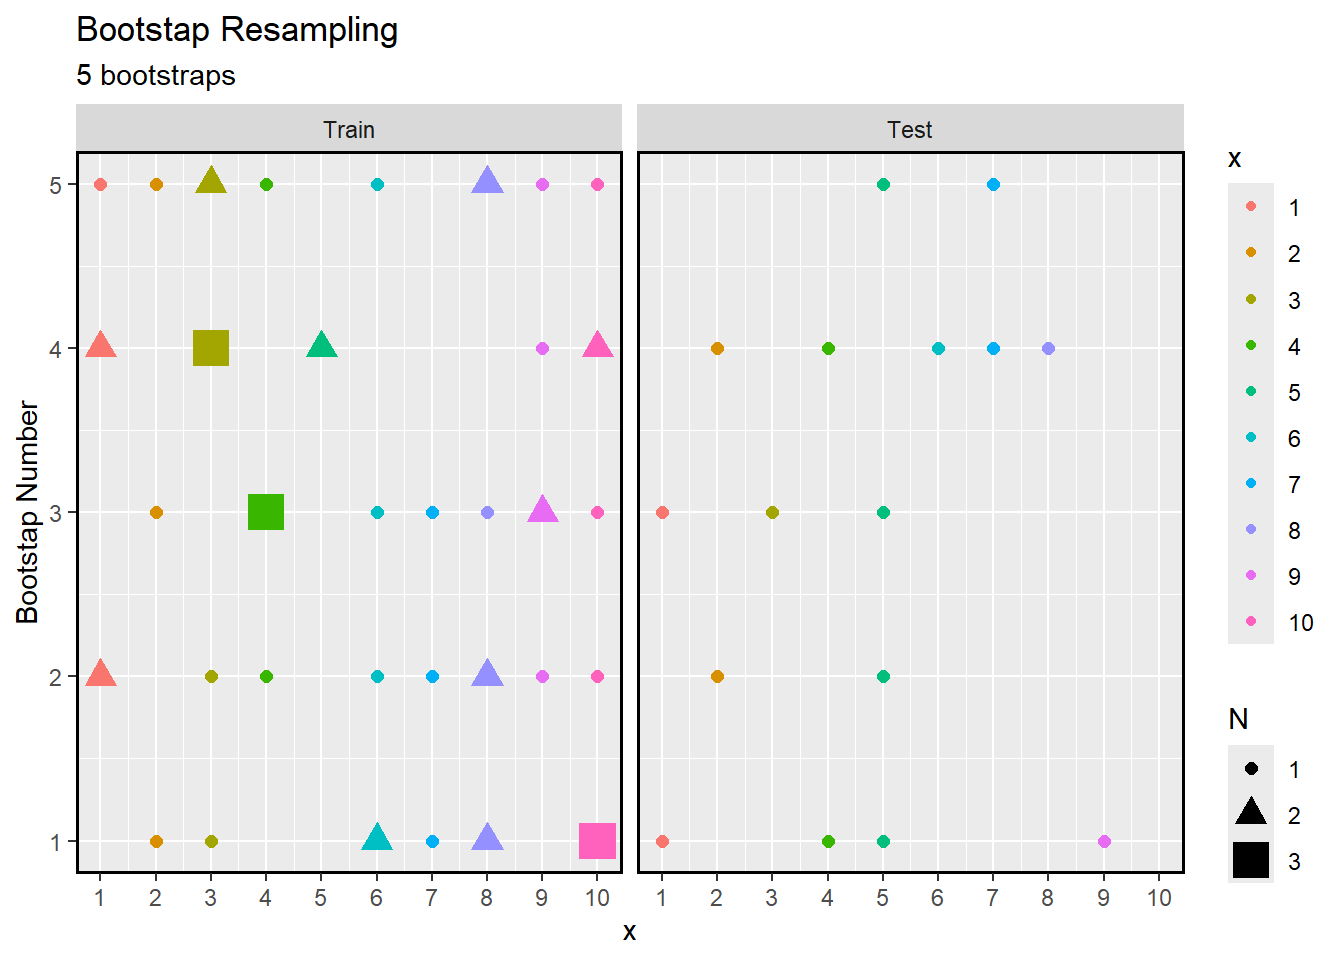
folds <- vfold_cv(dt, v=5)

fold_nums <- 1:5

X_analysis <- purrr::map(fold_nums, \(fn) {
  (folds %>%
    filter(id == paste0('Fold',fn)))$splits[[1]] %>%
    analysis() %>%
    mutate(fold_num = fn, data_type = 'analysis')}) %>%
  list_rbind()

X_assessment <- purrr::map(fold_nums, \(fn) {
  (folds %>%
    filter(id == paste0('Fold',fn)))$splits[[1]] %>%
    assessment() %>%
    mutate(fold_num = fn, data_type = 'assessment')}) %>%
  list_rbind()

X_folds <- bind_rows(X_analysis, X_assessment)

X_folds %>%
  mutate(fold_num = paste0("Fold ", fold_num)) %>%
  mutate(data_type = case_when(
    data_type == "analysis" ~ "Train",
    data_type == "assessment" ~ "Test"
  )) %>%
  mutate(data_type = factor(data_type, levels = c("Train", "Test"))) %>%
  ggplot(aes(x = x,
             y = fold_num,
             color = data_type,
             shape = data_type)) +
  geom_point(size =10 ) +
  scale_fill_brewer(palette = "Set1") +
  scale_color_brewer(palette = "Set2") +
  theme_minimal() +
  theme(legend.position = "bottom",
        panel.border = element_rect(colour = "black", fill=NA, size=1)) +
  scale_x_continuous(breaks = 1:10, labels = as.character(1:10)) +
  labs(x = "X",
       y = "Fold",
       fill = "Data Type",
       title = "Cross-Fold Validation")
Ignoring unknown labels:
• fill : "Data Type"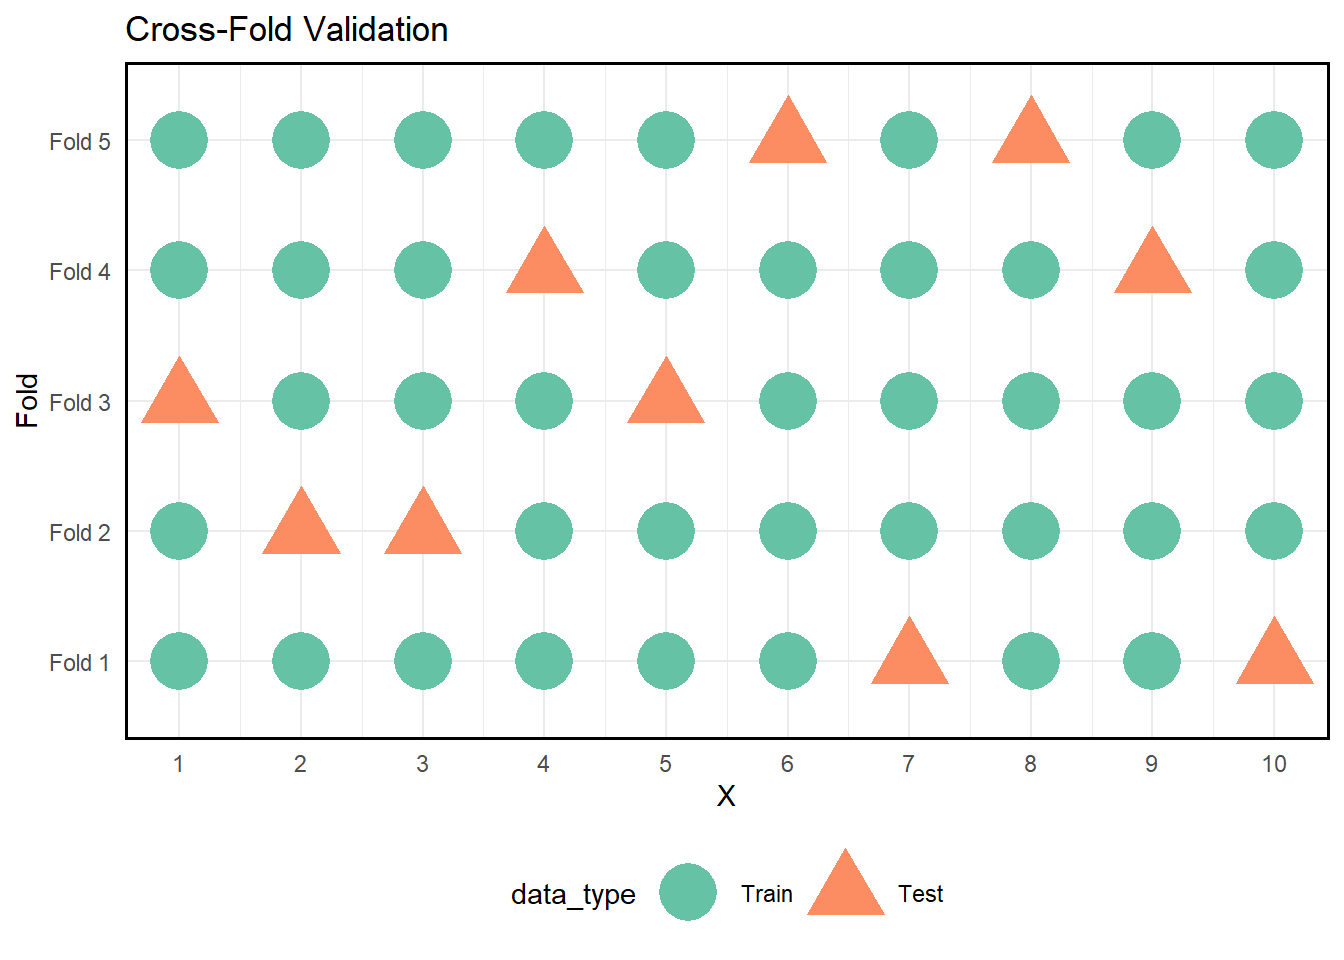
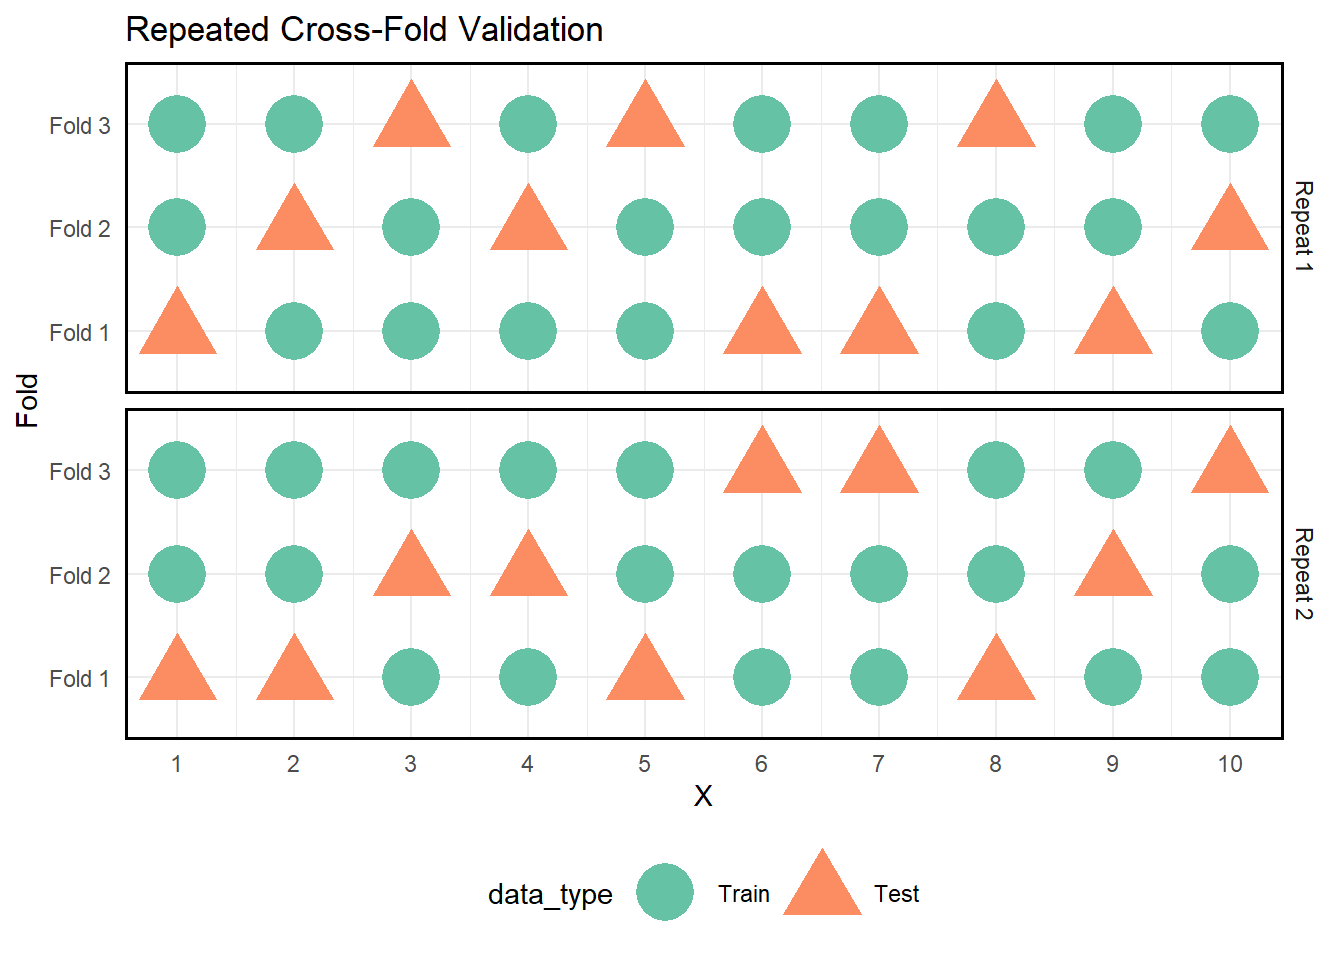
# Create a 5-fold cross-validation object
folds <- vfold_cv(dt, v=3, repeats=2)

fold_nums <- 1:3
repeat_nums <- 1:2

combinations <- expand.grid(fold_nums, repeat_nums)

X_analysis <- purrr::map2(combinations$Var1, combinations$Var2, \(fn, rn) {
  (folds %>%
    filter(id == paste0('Repeat',rn) &
           id2 == paste0('Fold',fn)))$splits[[1]] %>%
    analysis() %>%
    mutate(fold_num = fn,
           repeat_num = rn,
           data_type = 'analysis')}) %>%
  list_rbind()

X_assessment <- purrr::map2(combinations$Var1, combinations$Var2, \(fn, rn) {
  (folds %>%
     filter(id == paste0('Repeat',rn) &
              id2 == paste0('Fold',fn)))$splits[[1]] %>%
    assessment() %>%
    mutate(fold_num = fn,
           repeat_num = rn,
           data_type = 'assessment')}) %>%
  list_rbind()


X_folds <- bind_rows(X_analysis, X_assessment)
X_folds %>%
mutate(fold_num = paste0("Fold ", fold_num)) %>%
mutate(repeat_num = paste0("Repeat ", repeat_num)) %>%
mutate(data_type = case_when(
data_type == "analysis" ~ "Train",
data_type == "assessment" ~ "Test"
)) %>%
mutate(data_type = factor(data_type, levels = c("Train", "Test"))) %>%
ggplot(aes(x = x,
y = fold_num,
color = data_type,
shape = data_type)) +
geom_point(size =10 ) +
scale_fill_brewer(palette = "Set1") +
scale_color_brewer(palette = "Set2") +
theme_minimal() +
theme(legend.position = "bottom",
panel.border = element_rect(colour = "black", fill=NA, size=1)) +
facet_grid(repeat_num~.) +
scale_x_continuous(breaks = 1:10, labels = as.character(1:10)) +
labs(x = "X",
y = "Fold",
fill = "Data Type",
title = "Repeated Cross-Fold Validation")Ignoring unknown labels:
• fill : "Data Type"