24  RandomForest with caret

\(~\)

\(~\)

\(~\)

24.1 Read in the Data

── Attaching core tidyverse packages ──────────────────────── tidyverse 2.0.0 ──
✔ dplyr     1.1.4     ✔ readr     2.1.5
✔ forcats   1.0.0     ✔ stringr   1.5.1
✔ ggplot2   3.5.1     ✔ tibble    3.2.1
✔ lubridate 1.9.3     ✔ tidyr     1.3.1
✔ purrr     1.0.2     
── Conflicts ────────────────────────────────────────── tidyverse_conflicts() ──
✖ dplyr::filter() masks stats::filter()
✖ dplyr::lag()    masks stats::lag()
ℹ Use the conflicted package (<http://conflicted.r-lib.org/>) to force all conflicts to become errors
library(NHANES)

NHANES_DATA_12 <- NHANES %>% 
  select(-DiabetesAge) %>%
  filter(SurveyYr =='2011_12') 

SumNa <- function(col){sum(is.na(col))}

data.sum <- NHANES_DATA_12 %>% 
  summarise_all(SumNa) %>%
  tidyr::gather(key='feature', value='SumNa') %>%
  arrange(-SumNa) %>%
  mutate(PctNa = SumNa/nrow(NHANES_DATA_12))

data.sum2 <- data.sum %>% 
  filter(! (feature %in% c('ID','Diabetes'))) %>%
  filter(PctNa < .55)

data.sum2$feature
 [1] "PhysActiveDays"  "SexOrientation"  "SexNumPartYear"  "Marijuana"      
 [5] "RegularMarij"    "AlcoholDay"      "SexAge"          "SexNumPartnLife"
 [9] "HardDrugs"       "SexEver"         "SameSex"         "AlcoholYear"    
[13] "LittleInterest"  "Depressed"       "Alcohol12PlusYr" "Education"      
[17] "MaritalStatus"   "Smoke100"        "Smoke100n"       "DaysPhysHlthBad"
[21] "DaysMentHlthBad" "HealthGen"       "SleepHrsNight"   "Work"           
[25] "SleepTrouble"    "BPSys1"          "BPDia1"          "Testosterone"   
[29] "PhysActive"      "BPSys2"          "BPDia2"          "UrineFlow1"     
[33] "BPSys3"          "BPDia3"          "DirectChol"      "TotChol"        
[37] "BPSysAve"        "BPDiaAve"        "Pulse"           "UrineVol1"      
[41] "HHIncome"        "HHIncomeMid"     "Poverty"         "BMI_WHO"        
[45] "AgeDecade"       "BMI"             "Height"          "TVHrsDay"       
[49] "CompHrsDay"      "Weight"          "HomeRooms"       "HomeOwn"        
[53] "SurveyYr"        "Gender"          "Age"             "Race1"          
[57] "Race3"          
data_F <- NHANES_DATA_12 %>% 
  select(ID, Diabetes, data.sum2$feature) %>%
  filter(!is.na(Diabetes)) %>%
  na.omit()

\(~\)

\(~\)


\(~\)

\(~\)

24.1.1 Install if not Function

install_if_not <- function( list.of.packages ) {
  new.packages <- list.of.packages[!(list.of.packages %in% installed.packages()[,"Package"])]
  if(length(new.packages)) { install.packages(new.packages) } else { print(paste0("the package '", list.of.packages , "' is already installed")) }
}

\(~\)

\(~\)

\(~\)

24.2 Getting Started with caret

The caret package is short for Classification And REgression Training.

It contains many useful functions for modeling.

For starters we can split data into training and testing sets with the caret::createDataPartition function:

Loading required package: lattice

Attaching package: 'caret'
The following object is masked from 'package:purrr':

    lift
# this will ensure our results are the same every run, to randomize you may use: set.seed(Sys.time())
set.seed(8675309)


# The createDataPartition function is used to create training and test sets
trainIndex <- createDataPartition(data_F$Diabetes, 
                                  p = .6, 
                                  list = FALSE, 
                                  times = 1)

TRAIN <- data_F[trainIndex, ]
TEST <- data_F[-trainIndex, ]

\(~\)

\(~\)

24.3 Grid Search with caret

The primary use of the caret package is to aide with performing resampling methods such as cross-validation, boosting.

For a list of models available to caret you can reference http://topepo.github.io/caret/available-models.html this is a list of models that are compatable with caret and corresponding list of available tuning parameters for the model.

For instance, the randomForest package only has one available tuning parameter, mtry.

What caret will enable us to do is to test the different values of mtry.

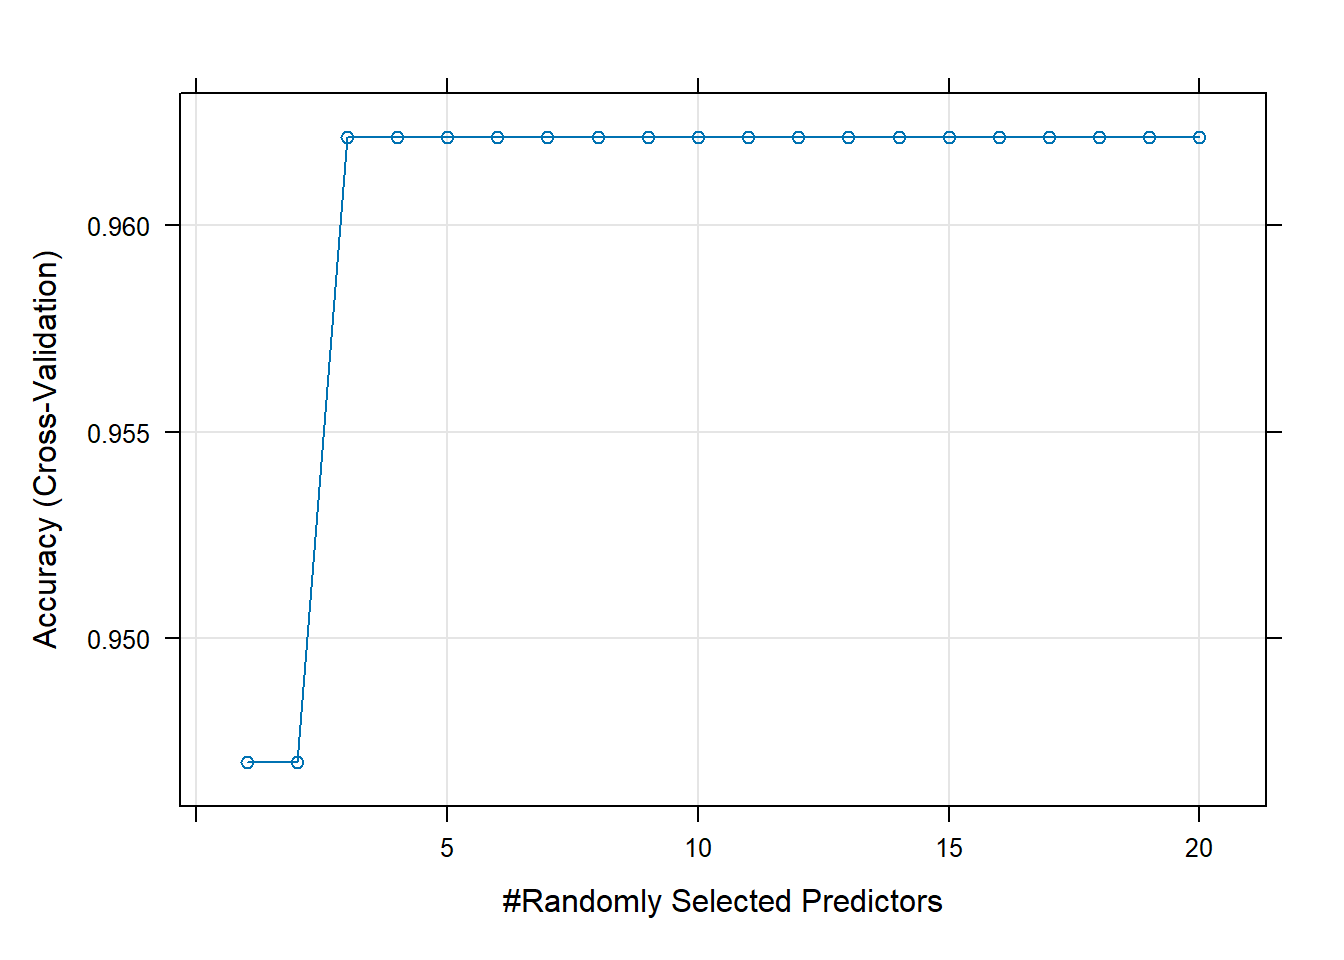
Here, we will use a 5-fold cross-validated model over the grid of available options for mtry and see which performs best:

library(caret)

grid_rf <- expand.grid( mtry=c(1:20) )

grid_rf
   mtry
1     1
2     2
3     3
4     4
5     5
6     6
7     7
8     8
9     9
10   10
11   11
12   12
13   13
14   14
15   15
16   16
17   17
18   18
19   19
20   20
dim(grid_rf)
[1] 20  1
train_ctrl <- trainControl(method="cv", # type of resampling in this case Cross-Validated
                           number=5, # number of folds
                           search = "grid" # we are performing a "grid-search"
                           )


model_cv_grid <- train(Diabetes ~ .,
                       data = TRAIN,
                       method = "rf", # this will use the randomForest::randomForest function
                       metric = "Accuracy", # which metric should be optimized for 
                       trControl = train_ctrl, 
                       tuneGrid = grid_rf,
                       # options to be passed to randomForest
                       ntree = 741,
                       keep.forest=TRUE,
                       importance=TRUE
                       ) 

model_cv_grid
Random Forest 

396 samples
 58 predictor
  2 classes: 'No', 'Yes' 

No pre-processing
Resampling: Cross-Validated (5 fold) 
Summary of sample sizes: 317, 316, 317, 317, 317 
Resampling results across tuning parameters:

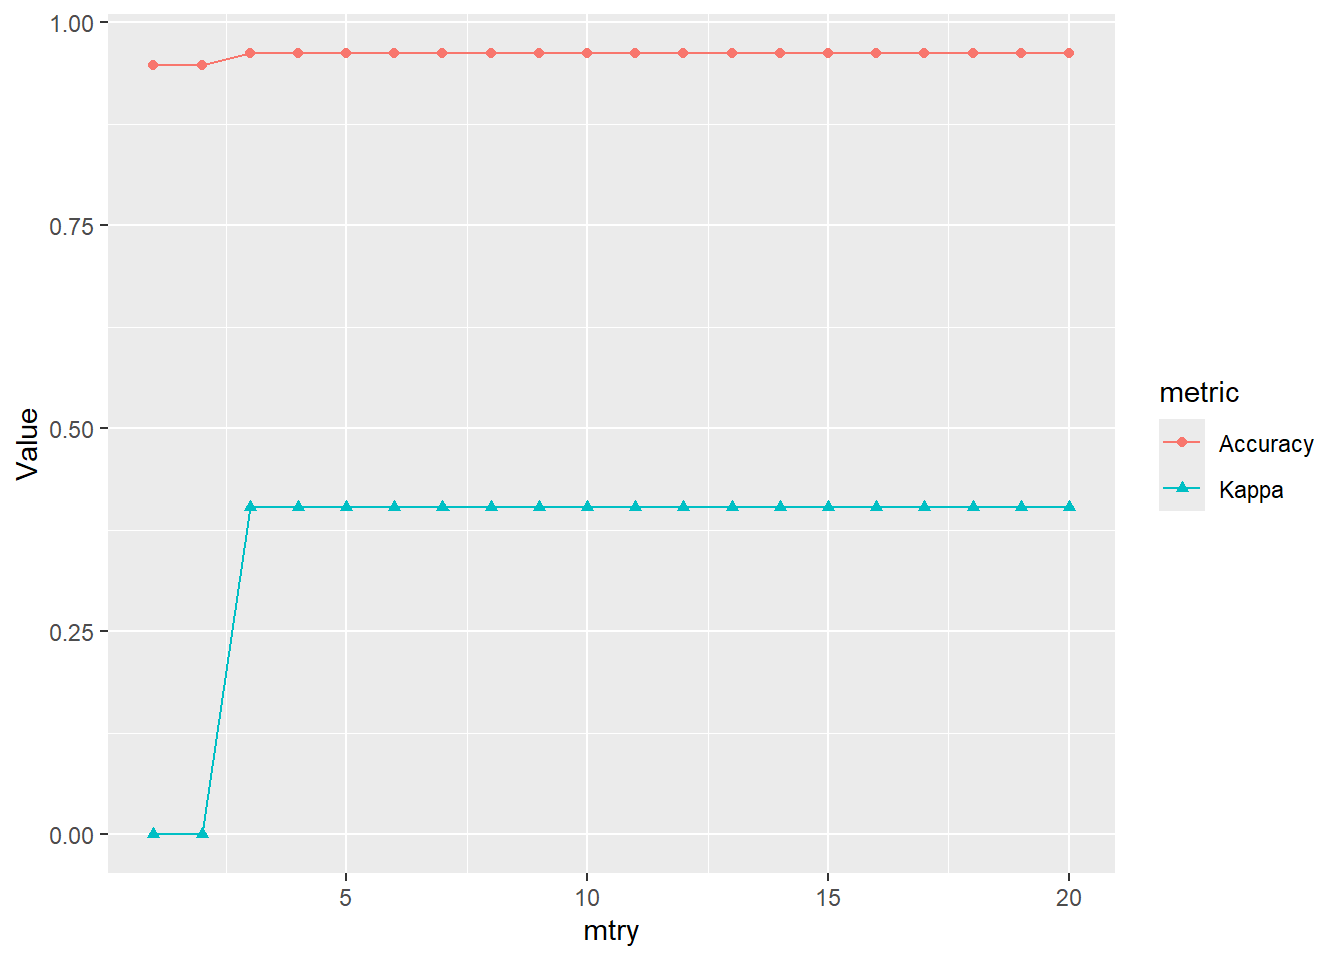
  mtry  Accuracy   Kappa    
   1    0.9469937  0.0000000
   2    0.9469937  0.0000000
   3    0.9621519  0.4033579
   4    0.9621519  0.4033579
   5    0.9621519  0.4033579
   6    0.9621519  0.4033579
   7    0.9621519  0.4033579
   8    0.9621519  0.4033579
   9    0.9621519  0.4033579
  10    0.9621519  0.4033579
  11    0.9621519  0.4033579
  12    0.9621519  0.4033579
  13    0.9621519  0.4033579
  14    0.9621519  0.4033579
  15    0.9621519  0.4033579
  16    0.9621519  0.4033579
  17    0.9621519  0.4033579
  18    0.9621519  0.4033579
  19    0.9621519  0.4033579
  20    0.9621519  0.4033579

Accuracy was used to select the optimal model using the largest value.
The final value used for the model was mtry = 3.
plot(model_cv_grid)

str(model_cv_grid,1)
List of 25
 $ method      : chr "rf"
 $ modelInfo   :List of 15
 $ modelType   : chr "Classification"
 $ results     :'data.frame':   20 obs. of  5 variables:
 $ pred        : NULL
 $ bestTune    :'data.frame':   1 obs. of  1 variable:
 $ call        : language train.formula(form = Diabetes ~ ., data = TRAIN, method = "rf", metric = "Accuracy",      trControl = train_ctrl,| __truncated__ ...
 $ dots        :List of 3
 $ metric      : chr "Accuracy"
 $ control     :List of 27
 $ finalModel  :List of 23
  ..- attr(*, "class")= chr "randomForest"
 $ preProcess  : NULL
 $ trainingData: tibble [396 × 59] (S3: tbl_df/tbl/data.frame)
  ..- attr(*, "na.action")= 'omit' Named int [1:4276] 1 3 4 5 6 7 8 9 10 12 ...
  .. ..- attr(*, "names")= chr [1:4276] "1" "3" "4" "5" ...
 $ ptype       : tibble [0 × 58] (S3: tbl_df/tbl/data.frame)
  ..- attr(*, "na.action")= 'omit' Named int [1:4276] 1 3 4 5 6 7 8 9 10 12 ...
  .. ..- attr(*, "names")= chr [1:4276] "1" "3" "4" "5" ...
 $ resample    :'data.frame':   5 obs. of  3 variables:
 $ resampledCM :'data.frame':   100 obs. of  6 variables:
 $ perfNames   : chr [1:2] "Accuracy" "Kappa"
 $ maximize    : logi TRUE
 $ yLimits     : NULL
 $ times       :List of 3
 $ levels      : chr [1:2] "No" "Yes"
  ..- attr(*, "ordered")= logi FALSE
 $ terms       :Classes 'terms', 'formula'  language Diabetes ~ ID + PhysActiveDays + SexOrientation + SexNumPartYear + Marijuana +      RegularMarij + AlcoholDay + S| __truncated__ ...
  .. ..- attr(*, "variables")= language list(Diabetes, ID, PhysActiveDays, SexOrientation, SexNumPartYear, Marijuana,      RegularMarij, AlcoholDay, SexA| __truncated__ ...
  .. ..- attr(*, "factors")= int [1:59, 1:58] 0 1 0 0 0 0 0 0 0 0 ...
  .. .. ..- attr(*, "dimnames")=List of 2
  .. ..- attr(*, "term.labels")= chr [1:58] "ID" "PhysActiveDays" "SexOrientation" "SexNumPartYear" ...
  .. ..- attr(*, "order")= int [1:58] 1 1 1 1 1 1 1 1 1 1 ...
  .. ..- attr(*, "intercept")= int 1
  .. ..- attr(*, "response")= int 1
  .. ..- attr(*, ".Environment")=<environment: R_GlobalEnv> 
  .. ..- attr(*, "predvars")= language list(Diabetes, ID, PhysActiveDays, SexOrientation, SexNumPartYear, Marijuana,      RegularMarij, AlcoholDay, SexA| __truncated__ ...
  .. ..- attr(*, "dataClasses")= Named chr [1:59] "factor" "numeric" "numeric" "factor" ...
  .. .. ..- attr(*, "names")= chr [1:59] "Diabetes" "ID" "PhysActiveDays" "SexOrientation" ...
 $ coefnames   : chr [1:108] "ID" "PhysActiveDays" "SexOrientationHeterosexual" "SexOrientationHomosexual" ...
 $ contrasts   :List of 27
 $ xlevels     :List of 27
 - attr(*, "class")= chr [1:2] "train" "train.formula"
model_cv_grid$bestTune$mtry 
[1] 3
model_cv_grid$results
   mtry  Accuracy     Kappa  AccuracySD   KappaSD
1     1 0.9469937 0.0000000 0.005307123 0.0000000
2     2 0.9469937 0.0000000 0.005307123 0.0000000
3     3 0.9621519 0.4033579 0.012502203 0.2723539
4     4 0.9621519 0.4033579 0.012502203 0.2723539
5     5 0.9621519 0.4033579 0.012502203 0.2723539
6     6 0.9621519 0.4033579 0.012502203 0.2723539
7     7 0.9621519 0.4033579 0.012502203 0.2723539
8     8 0.9621519 0.4033579 0.012502203 0.2723539
9     9 0.9621519 0.4033579 0.012502203 0.2723539
10   10 0.9621519 0.4033579 0.012502203 0.2723539
11   11 0.9621519 0.4033579 0.012502203 0.2723539
12   12 0.9621519 0.4033579 0.012502203 0.2723539
13   13 0.9621519 0.4033579 0.012502203 0.2723539
14   14 0.9621519 0.4033579 0.012502203 0.2723539
15   15 0.9621519 0.4033579 0.012502203 0.2723539
16   16 0.9621519 0.4033579 0.012502203 0.2723539
17   17 0.9621519 0.4033579 0.012502203 0.2723539
18   18 0.9621519 0.4033579 0.012502203 0.2723539
19   19 0.9621519 0.4033579 0.012502203 0.2723539
20   20 0.9621519 0.4033579 0.012502203 0.2723539
model_cv_grid$results %>%
  select(mtry, Accuracy, Kappa) %>%
  gather(-mtry, key="metric", value="Value") %>%
  ggplot(aes(x=mtry, y=Value, color = metric, shape=metric ) ) + 
     geom_point() + 
     geom_line()

model_cv_grid$finalModel

Call:
 randomForest(x = x, y = y, ntree = 741, mtry = param$mtry, importance = TRUE,      keep.forest = TRUE) 
               Type of random forest: classification
                     Number of trees: 741
No. of variables tried at each split: 3

        OOB estimate of  error rate: 3.79%
Confusion matrix:
     No Yes class.error
No  375   0   0.0000000
Yes  15   6   0.7142857

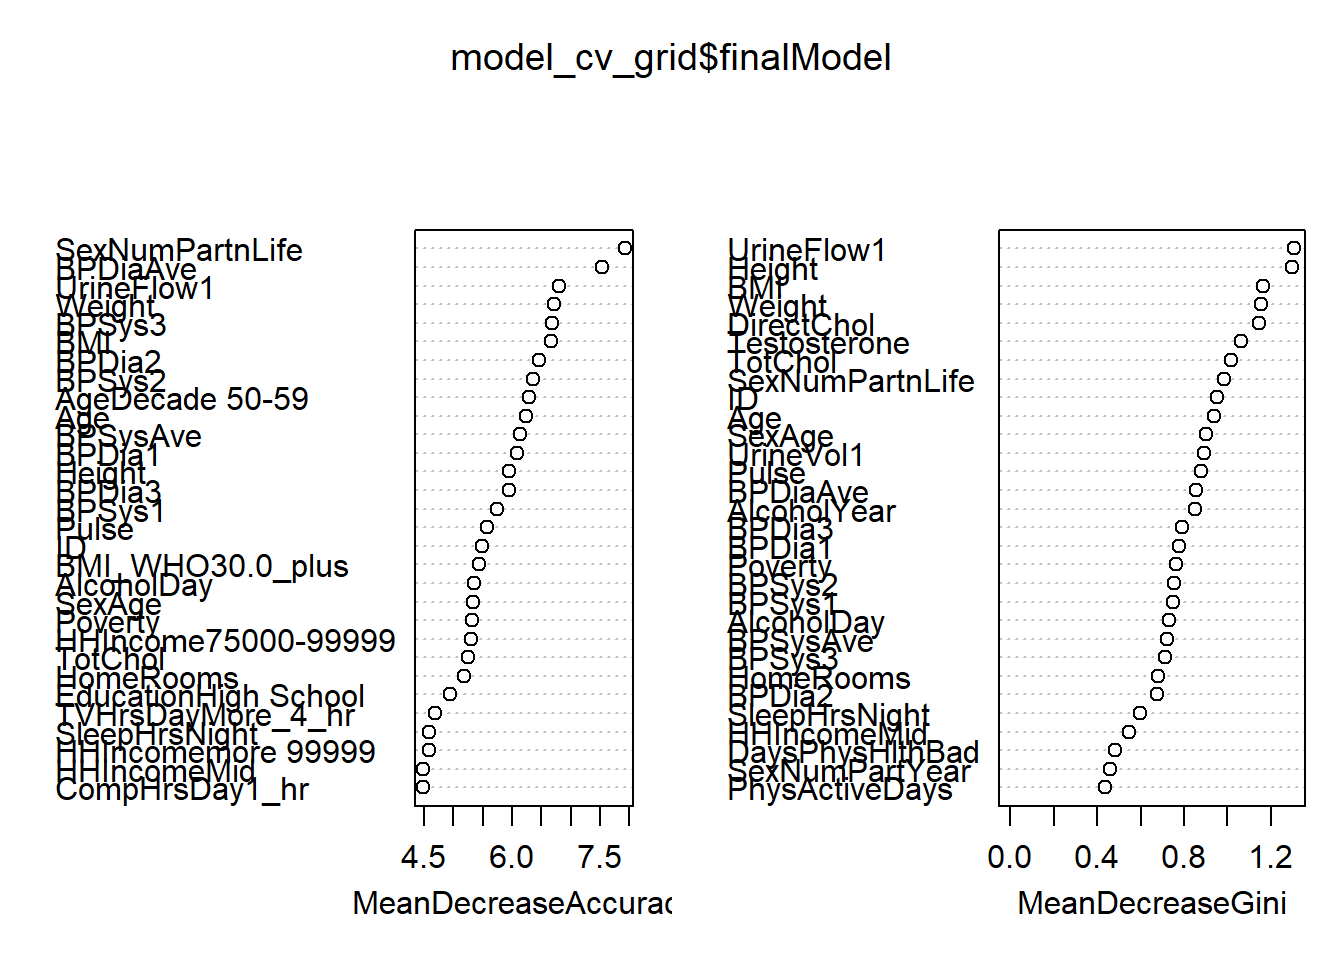
24.3.1 Feature Importances

varImp(model_cv_grid)
rf variable importance

  only 20 most important variables shown (out of 108)

                Importance
SexNumPartnLife     100.00
UrineFlow1           89.84
BMI                  88.83
BPDiaAve             87.60
AgeDecade 50-59      85.30
BPDia2               84.98
Age                  84.57
Height               82.30
BPDia3               81.90
BPDia1               78.03
Weight               77.97
Pulse                77.88
BPSys2               77.55
BPSys3               75.83
BPSys1               74.15
TotChol              72.19
ID                   71.92
AlcoholDay           71.77
SexAge               71.25
SleepHrsNight        70.71
model_cv_grid$finalModel$importance
                                      No           Yes MeanDecreaseAccuracy
ID                          8.341262e-04  9.954437e-03         1.296629e-03
PhysActiveDays              1.913270e-04  5.194659e-03         4.409630e-04
SexOrientationHeterosexual  4.078457e-05  0.000000e+00         3.872420e-05
SexOrientationHomosexual    2.014220e-05  0.000000e+00         1.874344e-05
SexNumPartYear              4.043881e-04  4.405439e-03         5.987866e-04
MarijuanaYes                5.694672e-04  1.999609e-03         6.194468e-04
RegularMarijYes             2.395877e-04  4.021971e-03         4.165889e-04
AlcoholDay                  5.510716e-04  1.508019e-02         1.301528e-03
SexAge                      5.670584e-04  1.286708e-02         1.134064e-03
SexNumPartnLife             1.502080e-03  1.973325e-02         2.440264e-03
HardDrugsYes                4.022662e-04  7.202589e-03         7.416562e-04
SexEverYes                  0.000000e+00  0.000000e+00         0.000000e+00
SameSexYes                  1.180457e-04  1.103721e-03         1.579279e-04
AlcoholYear                 7.051510e-04  4.343673e-03         8.746739e-04
LittleInterestSeveral       3.007011e-04  1.881890e-03         3.774726e-04
LittleInterestMost          6.030607e-05  0.000000e+00         5.729313e-05
DepressedSeveral            1.507222e-04 -2.211726e-04         1.433751e-04
DepressedMost               5.918036e-05  3.748688e-04         7.489524e-05
Alcohol12PlusYrYes          8.051732e-05  0.000000e+00         7.605402e-05
Education9 - 11th Grade    -9.127885e-05  5.735493e-04        -5.573739e-05
EducationHigh School        5.210412e-04  5.042536e-03         7.195073e-04
EducationSome College       2.309968e-04  3.854771e-03         3.972307e-04
EducationCollege Grad       3.334475e-04  4.666045e-03         5.840761e-04
MaritalStatusLivePartner    2.086221e-04  2.472041e-03         3.166085e-04
MaritalStatusMarried        1.044386e-04  4.013822e-03         3.004816e-04
MaritalStatusNeverMarried   1.272860e-04  4.006325e-03         3.330597e-04
MaritalStatusSeparated     -9.528178e-05 -5.087018e-04        -1.179922e-04
MaritalStatusWidowed        0.000000e+00  0.000000e+00         0.000000e+00
Smoke100Yes                 5.676440e-04  2.452859e-03         6.503419e-04
Smoke100nSmoker             2.826617e-04  3.094323e-03         4.274327e-04
DaysPhysHlthBad             3.288388e-04  5.964844e-03         6.405180e-04
DaysMentHlthBad             1.149341e-04  3.819797e-03         3.250520e-04
HealthGenVgood              2.249076e-04  2.806696e-03         3.646914e-04
HealthGenGood               2.669887e-04  2.589872e-03         3.925381e-04
HealthGenFair               1.324826e-05  4.174529e-03         2.112347e-04
HealthGenPoor              -3.874664e-05 -1.499475e-04        -4.537051e-05
SleepHrsNight               7.283011e-04  7.420762e-03         1.062441e-03
WorkNotWorking              2.582079e-05  3.484591e-03         2.099249e-04
WorkWorking                 2.493450e-04  5.431946e-03         4.293637e-04
SleepTroubleYes             6.963944e-04  3.567680e-03         8.229261e-04
BPSys1                      1.649495e-03  7.107561e-03         1.910941e-03
BPDia1                      1.739677e-03  1.109493e-02         2.209947e-03
Testosterone                6.469916e-04  7.214112e-03         1.001948e-03
PhysActiveYes               6.315495e-04  3.636763e-03         7.891283e-04
BPSys2                      2.287912e-03  5.732830e-03         2.459610e-03
BPDia2                      1.898107e-03  8.555772e-03         2.240932e-03
UrineFlow1                  1.469049e-03  1.503415e-02         2.171559e-03
BPSys3                      2.615702e-03  6.064321e-03         2.823036e-03
BPDia3                      1.550011e-03  1.079846e-02         2.037198e-03
DirectChol                  6.715118e-04  1.007073e-02         1.141932e-03
TotChol                     9.181682e-04  8.394900e-03         1.318147e-03
BPSysAve                    1.782187e-03  5.352883e-03         1.995548e-03
BPDiaAve                    2.572784e-03  1.294737e-02         2.974411e-03
Pulse                       9.866097e-04  1.253665e-02         1.591740e-03
UrineVol1                   6.783902e-04  6.627759e-03         1.014965e-03
HHIncome 5000-9999          1.078202e-04  0.000000e+00         1.019838e-04
HHIncome10000-14999         4.953798e-05  6.185335e-04         6.543739e-05
HHIncome15000-19999         5.005108e-05  0.000000e+00         4.727516e-05
HHIncome20000-24999         4.106650e-05 -2.174239e-04         2.946806e-05
HHIncome25000-34999         8.992583e-05 -3.003332e-04         7.675864e-05
HHIncome35000-44999         1.980914e-04  5.050505e-04         2.070784e-04
HHIncome45000-54999         6.082102e-05 -3.063363e-04         2.668529e-05
HHIncome55000-64999        -4.554397e-06  3.213161e-05        -7.062565e-06
HHIncome65000-74999         5.804912e-05  7.625902e-04         9.082183e-05
HHIncome75000-99999         4.761815e-04  1.082462e-02         9.346937e-04
HHIncomemore 99999          6.094297e-04  4.870665e-03         8.381542e-04
HHIncomeMid                 1.004284e-03  3.775562e-03         1.182149e-03
Poverty                     1.390839e-03  3.966258e-03         1.523497e-03
BMI_WHO18.5_to_24.9         7.001008e-04  1.006255e-03         7.143621e-04
BMI_WHO25.0_to_29.9         6.224625e-04  1.947127e-03         6.934010e-04
BMI_WHO30.0_plus            1.158913e-03  7.343208e-03         1.479369e-03
AgeDecade 10-19             0.000000e+00  0.000000e+00         0.000000e+00
AgeDecade 20-29             2.453518e-04  2.460210e-03         3.635919e-04
AgeDecade 30-39             2.579051e-04  2.407826e-03         3.642544e-04
AgeDecade 40-49             2.130089e-04  4.451883e-03         3.939345e-04
AgeDecade 50-59             9.069346e-04  1.360311e-02         1.506555e-03
AgeDecade 60-69             0.000000e+00  0.000000e+00         0.000000e+00
AgeDecade 70+               0.000000e+00  0.000000e+00         0.000000e+00
BMI                         1.783865e-03  1.450536e-02         2.446608e-03
Height                      7.517342e-04  1.269575e-02         1.355632e-03
TVHrsDay0_to_1_hr           1.085984e-04  9.757936e-04         1.745445e-04
TVHrsDay1_hr                7.074222e-05  7.111310e-04         1.032728e-04
TVHrsDay2_hr                1.481450e-04  2.233196e-03         2.381488e-04
TVHrsDay3_hr                3.775136e-04  4.323308e-03         5.826369e-04
TVHrsDay4_hr               -8.533808e-05  1.959541e-04        -7.175324e-05
TVHrsDayMore_4_hr           2.392996e-04  1.053995e-02         7.992061e-04
CompHrsDay0_to_1_hr         3.836207e-04  1.587852e-03         4.514624e-04
CompHrsDay1_hr              6.332322e-04  3.875218e-03         8.066848e-04
CompHrsDay2_hr              1.084903e-04  2.238469e-03         2.375355e-04
CompHrsDay3_hr             -9.844473e-05  0.000000e+00        -9.401935e-05
CompHrsDay4_hr              3.895439e-05  2.249213e-04         4.631112e-05
CompHrsDayMore_4_hr         3.726164e-05 -6.871296e-04         7.395513e-06
Weight                      2.410584e-03  1.251572e-02         2.977781e-03
HomeRooms                   7.544334e-04  1.011076e-02         1.135259e-03
HomeOwnRent                 2.751140e-04  3.962412e-03         4.348997e-04
HomeOwnOther               -7.803824e-06  0.000000e+00        -8.160400e-06
SurveyYr2011_12             0.000000e+00  0.000000e+00         0.000000e+00
Gendermale                  5.215084e-04  1.343116e-03         5.569063e-04
Age                         1.241782e-03  1.458257e-02         1.939388e-03
Race1Hispanic               1.920406e-05  0.000000e+00         1.827632e-05
Race1Mexican                5.982145e-05  6.313862e-04         8.658560e-05
Race1White                  2.662379e-04  1.772643e-03         3.344663e-04
Race1Other                 -1.942956e-05  0.000000e+00        -1.844590e-05
Race3Black                  1.725566e-04 -6.632294e-05         1.562583e-04
Race3Hispanic               4.918663e-05  2.249213e-04         5.570617e-05
Race3Mexican                6.099103e-05  2.913753e-04         7.729055e-05
Race3White                  1.020431e-04  1.772010e-03         1.819081e-04
Race3Other                 -9.243340e-06  0.000000e+00        -8.937269e-06
                           MeanDecreaseGini
ID                              0.953575113
PhysActiveDays                  0.436855738
SexOrientationHeterosexual      0.012191179
SexOrientationHomosexual        0.016146206
SexNumPartYear                  0.458146997
MarijuanaYes                    0.237697524
RegularMarijYes                 0.188362481
AlcoholDay                      0.732289183
SexAge                          0.900136529
SexNumPartnLife                 0.986234958
HardDrugsYes                    0.232671098
SexEverYes                      0.000000000
SameSexYes                      0.043806337
AlcoholYear                     0.849765078
LittleInterestSeveral           0.178885366
LittleInterestMost              0.029787773
DepressedSeveral                0.125153985
DepressedMost                   0.028570997
Alcohol12PlusYrYes              0.039811904
Education9 - 11th Grade         0.135532238
EducationHigh School            0.243880297
EducationSome College           0.266807105
EducationCollege Grad           0.182457410
MaritalStatusLivePartner        0.126895581
MaritalStatusMarried            0.190186388
MaritalStatusNeverMarried       0.142570966
MaritalStatusSeparated          0.172002388
MaritalStatusWidowed            0.005332356
Smoke100Yes                     0.171877158
Smoke100nSmoker                 0.222814481
DaysPhysHlthBad                 0.480694433
DaysMentHlthBad                 0.393839839
HealthGenVgood                  0.231288451
HealthGenGood                   0.206952285
HealthGenFair                   0.153793434
HealthGenPoor                   0.087875710
SleepHrsNight                   0.597496812
WorkNotWorking                  0.138626351
WorkWorking                     0.128207176
SleepTroubleYes                 0.264568515
BPSys1                          0.750600927
BPDia1                          0.777318096
Testosterone                    1.060240631
PhysActiveYes                   0.252457009
BPSys2                          0.752997829
BPDia2                          0.674020159
UrineFlow1                      1.305087310
BPSys3                          0.713326620
BPDia3                          0.789175336
DirectChol                      1.144484933
TotChol                         1.018048867
BPSysAve                        0.719732353
BPDiaAve                        0.854062199
Pulse                           0.877995067
UrineVol1                       0.890773667
HHIncome 5000-9999              0.107402832
HHIncome10000-14999             0.022403055
HHIncome15000-19999             0.071829397
HHIncome20000-24999             0.071087188
HHIncome25000-34999             0.113894004
HHIncome35000-44999             0.083768362
HHIncome45000-54999             0.161515382
HHIncome55000-64999             0.169190284
HHIncome65000-74999             0.029874562
HHIncome75000-99999             0.299612021
HHIncomemore 99999              0.204972647
HHIncomeMid                     0.547676943
Poverty                         0.761119466
BMI_WHO18.5_to_24.9             0.168181127
BMI_WHO25.0_to_29.9             0.214158783
BMI_WHO30.0_plus                0.344434830
AgeDecade 10-19                 0.000000000
AgeDecade 20-29                 0.115816946
AgeDecade 30-39                 0.140955059
AgeDecade 40-49                 0.306516967
AgeDecade 50-59                 0.409172252
AgeDecade 60-69                 0.000000000
AgeDecade 70+                   0.000000000
BMI                             1.165174605
Height                          1.297876977
TVHrsDay0_to_1_hr               0.167720305
TVHrsDay1_hr                    0.125606432
TVHrsDay2_hr                    0.135858129
TVHrsDay3_hr                    0.216013652
TVHrsDay4_hr                    0.141444888
TVHrsDayMore_4_hr               0.254191216
CompHrsDay0_to_1_hr             0.190603248
CompHrsDay1_hr                  0.279361243
CompHrsDay2_hr                  0.117651584
CompHrsDay3_hr                  0.013406943
CompHrsDay4_hr                  0.032263125
CompHrsDayMore_4_hr             0.157265678
Weight                          1.154469690
HomeRooms                       0.680144963
HomeOwnRent                     0.256173655
HomeOwnOther                    0.077218701
SurveyYr2011_12                 0.000000000
Gendermale                      0.218110356
Age                             0.939226525
Race1Hispanic                   0.006655825
Race1Mexican                    0.097950546
Race1White                      0.144245730
Race1Other                      0.013926300
Race3Black                      0.088555704
Race3Hispanic                   0.015826232
Race3Mexican                    0.123686632
Race3White                      0.157132074
Race3Other                      0.006479537
randomForest::varImpPlot(model_cv_grid$finalModel)

as_tibble(model_cv_grid$finalModel$importance, rownames='Feature') %>%
  arrange(-MeanDecreaseAccuracy)
# A tibble: 108 × 5
   Feature              No     Yes MeanDecreaseAccuracy MeanDecreaseGini
   <chr>             <dbl>   <dbl>                <dbl>            <dbl>
 1 Weight          0.00241 0.0125               0.00298            1.15 
 2 BPDiaAve        0.00257 0.0129               0.00297            0.854
 3 BPSys3          0.00262 0.00606              0.00282            0.713
 4 BPSys2          0.00229 0.00573              0.00246            0.753
 5 BMI             0.00178 0.0145               0.00245            1.17 
 6 SexNumPartnLife 0.00150 0.0197               0.00244            0.986
 7 BPDia2          0.00190 0.00856              0.00224            0.674
 8 BPDia1          0.00174 0.0111               0.00221            0.777
 9 UrineFlow1      0.00147 0.0150               0.00217            1.31 
10 BPDia3          0.00155 0.0108               0.00204            0.789
# ℹ 98 more rows
as_tibble(model_cv_grid$finalModel$importance, rownames='Feature') %>%
  arrange(-MeanDecreaseGini)
# A tibble: 108 × 5
   Feature               No     Yes MeanDecreaseAccuracy MeanDecreaseGini
   <chr>              <dbl>   <dbl>                <dbl>            <dbl>
 1 UrineFlow1      0.00147  0.0150               0.00217            1.31 
 2 Height          0.000752 0.0127               0.00136            1.30 
 3 BMI             0.00178  0.0145               0.00245            1.17 
 4 Weight          0.00241  0.0125               0.00298            1.15 
 5 DirectChol      0.000672 0.0101               0.00114            1.14 
 6 Testosterone    0.000647 0.00721              0.00100            1.06 
 7 TotChol         0.000918 0.00839              0.00132            1.02 
 8 SexNumPartnLife 0.00150  0.0197               0.00244            0.986
 9 ID              0.000834 0.00995              0.00130            0.954
10 Age             0.00124  0.0146               0.00194            0.939
# ℹ 98 more rows

24.3.2 Score Testing Set

probs <- predict(model_cv_grid , TEST,"prob")
class <- predict(model_cv_grid , TEST,"raw")

TEST.scored <- cbind(TEST , probs, class )
glimpse(TEST.scored)
Rows: 264
Columns: 62
$ ID              <int> 62172, 62199, 62231, 62340, 62444, 62460, 62481, 62552…
$ Diabetes        <fct> No, No, No, No, No, No, No, No, No, No, No, No, No, No…
$ PhysActiveDays  <int> 2, 7, 3, 5, 6, 3, 3, 7, 1, 1, 2, 1, 7, 3, 5, 4, 3, 3, …
$ SexOrientation  <fct> Heterosexual, Homosexual, Heterosexual, Heterosexual, …
$ SexNumPartYear  <int> 2, 0, 1, 1, 2, 1, 2, 1, 1, 2, 2, 10, 1, 1, 0, 1, 1, 1,…
$ Marijuana       <fct> Yes, Yes, No, No, Yes, Yes, No, Yes, No, No, No, Yes, …
$ RegularMarij    <fct> No, No, No, No, No, No, No, No, No, No, No, Yes, No, Y…
$ AlcoholDay      <int> 3, 1, 2, 1, 4, 3, 2, 1, 1, 6, 6, 15, 1, 2, 1, 1, 1, 2,…
$ SexAge          <int> 17, 19, 14, 19, 17, 16, 20, 16, 24, 17, 17, 17, 18, 14…
$ SexNumPartnLife <int> 4, 6, 1, 5, 3, 50, 25, 10, 7, 7, 7, 300, 4, 5, 5, 1, 1…
$ HardDrugs       <fct> No, Yes, No, No, No, Yes, No, No, No, No, No, Yes, No,…
$ SexEver         <fct> Yes, Yes, Yes, Yes, Yes, Yes, Yes, Yes, Yes, Yes, Yes,…
$ SameSex         <fct> No, Yes, No, No, No, No, No, No, No, No, No, No, No, N…
$ AlcoholYear     <int> 104, 260, 3, 12, 52, 104, 6, 300, 24, 52, 52, 104, 52,…
$ LittleInterest  <fct> Several, None, None, Most, None, Several, None, None, …
$ Depressed       <fct> Most, None, None, Most, None, Several, None, None, Non…
$ Alcohol12PlusYr <fct> Yes, Yes, Yes, Yes, Yes, Yes, Yes, Yes, Yes, Yes, Yes,…
$ Education       <fct> High School, College Grad, High School, Some College, …
$ MaritalStatus   <fct> NeverMarried, LivePartner, Married, Married, NeverMarr…
$ Smoke100        <fct> Yes, Yes, No, No, No, Yes, No, Yes, No, Yes, Yes, Yes,…
$ Smoke100n       <fct> Smoker, Smoker, Non-Smoker, Non-Smoker, Non-Smoker, Sm…
$ DaysPhysHlthBad <int> 2, 0, 0, 0, 0, 0, 2, 0, 0, 1, 1, 7, 0, 2, 0, 0, 0, 0, …
$ DaysMentHlthBad <int> 10, 1, 0, 26, 0, 3, 30, 5, 0, 0, 0, 14, 0, 2, 0, 0, 0,…
$ HealthGen       <fct> Good, Vgood, Good, Vgood, Fair, Good, Vgood, Vgood, Ex…
$ SleepHrsNight   <int> 8, 8, 4, 6, 5, 6, 6, 8, 7, 6, 6, 6, 8, 6, 9, 7, 7, 6, …
$ Work            <fct> NotWorking, Working, Working, Working, Working, Workin…
$ SleepTrouble    <fct> No, No, No, No, No, Yes, No, No, No, No, No, Yes, No, …
$ BPSys1          <int> 100, 112, 120, 106, 112, 120, 98, 118, 102, 132, 132, …
$ BPDia1          <int> 70, 70, 70, 80, 54, 90, 56, 76, 62, 70, 70, 86, 76, 58…
$ Testosterone    <dbl> 47.53, 269.24, 14.90, 296.66, 19.76, 299.19, 48.93, 18…
$ PhysActive      <fct> No, Yes, No, No, Yes, Yes, No, Yes, Yes, Yes, Yes, Yes…
$ BPSys2          <int> 102, 108, 116, 106, 116, 124, 96, 108, 100, 124, 124, …
$ BPDia2          <int> 68, 64, 70, 82, 54, 88, 62, 80, 68, 66, 66, 72, 74, 62…
$ UrineFlow1      <dbl> 0.645, 0.380, 0.196, 0.623, 0.356, 0.498, 1.300, 1.500…
$ BPSys3          <int> 104, 112, 112, 106, 112, 130, 94, 120, 102, 126, 126, …
$ BPDia3          <int> 76, 66, 68, 80, 56, 90, 54, 76, 60, 70, 70, 70, 76, 60…
$ DirectChol      <dbl> 1.89, 0.91, 1.53, 0.98, 1.16, 1.37, 1.19, 1.81, 1.47, …
$ TotChol         <dbl> 4.37, 4.42, 4.71, 4.16, 4.34, 4.65, 3.83, 4.89, 4.34, …
$ BPSysAve        <int> 103, 110, 114, 106, 114, 127, 95, 114, 101, 125, 125, …
$ BPDiaAve        <int> 72, 65, 69, 81, 55, 89, 58, 78, 64, 68, 68, 71, 75, 61…
$ Pulse           <int> 80, 84, 64, 68, 68, 68, 78, 84, 72, 80, 80, 78, 58, 60…
$ UrineVol1       <int> 107, 65, 19, 96, 26, 118, 282, 72, 276, 106, 106, 91, …
$ HHIncome        <fct> 20000-24999, more 99999, more 99999, 25000-34999,  0-4…
$ HHIncomeMid     <int> 22500, 100000, 100000, 30000, 2500, 100000, 70000, 100…
$ Poverty         <dbl> 2.02, 5.00, 3.92, 1.28, 0.00, 4.34, 3.13, 4.07, 3.06, …
$ BMI_WHO         <fct> 30.0_plus, 25.0_to_29.9, 30.0_plus, 25.0_to_29.9, 30.0…
$ AgeDecade       <fct>  40-49,  50-59,  40-49,  40-49,  20-29,  40-49,  30-39…
$ BMI             <dbl> 33.3, 28.0, 33.2, 25.9, 33.6, 21.9, 27.7, 22.5, 27.8, …
$ Height          <dbl> 172.0, 186.0, 164.7, 173.2, 169.3, 188.1, 170.5, 160.8…
$ TVHrsDay        <fct> More_4_hr, 1_hr, 2_hr, 3_hr, 4_hr, 1_hr, 1_hr, 2_hr, 0…
$ CompHrsDay      <fct> More_4_hr, 1_hr, 0_to_1_hr, 1_hr, 1_hr, 0_to_1_hr, 3_h…
$ Weight          <dbl> 98.6, 96.9, 90.1, 77.6, 96.4, 77.5, 80.5, 58.2, 87.2, …
$ HomeRooms       <int> 4, 4, 6, 6, 5, 11, 5, 7, 10, 1, 1, 8, 8, 13, 5, 8, 8, …
$ HomeOwn         <fct> Rent, Rent, Own, Own, Own, Own, Rent, Own, Own, Rent, …
$ SurveyYr        <fct> 2011_12, 2011_12, 2011_12, 2011_12, 2011_12, 2011_12, …
$ Gender          <fct> female, male, female, male, female, male, female, fema…
$ Age             <int> 43, 57, 48, 44, 23, 41, 39, 41, 32, 21, 21, 35, 57, 29…
$ Race1           <fct> Black, White, Mexican, White, Black, White, Hispanic, …
$ Race3           <fct> Black, White, Mexican, White, Black, White, Hispanic, …
$ No              <dbl> 0.9460189, 0.9716599, 0.9230769, 0.9919028, 0.9527665,…
$ Yes             <dbl> 0.053981107, 0.028340081, 0.076923077, 0.008097166, 0.…
$ class           <fct> No, No, No, No, No, No, No, No, No, No, No, No, No, No…
24.4 Random Search with caret

Another option, is to have caret randomly sample the tuning parameters for you:

train_ctrl_rand <- trainControl(method="boot", # type of resampling, in this case bootstrap
                                number = 13, # number of resamplings     
                                search = "random" # we are performing a "random" search
                                )
                           
model_boot_rand <- train(Diabetes ~ .,
                         data = TRAIN,
                         method = "rf", # this will use the randomForest::randomForest function
                         metric = "Accuracy", # which metric should be optimized for 
                         trControl = train_ctrl_rand, 
                         # options to be passed to randomForest
                         ntree = 741 )

model_boot_rand                         
Random Forest 

396 samples
 58 predictor
  2 classes: 'No', 'Yes' 

No pre-processing
Resampling: Bootstrapped (13 reps) 
Summary of sample sizes: 396, 396, 396, 396, 396, 396, ... 
Resampling results across tuning parameters:

  mtry  Accuracy   Kappa    
  17    0.9582423  0.3002562
  21    0.9582423  0.3002562
  78    0.9529188  0.2676311

Accuracy was used to select the optimal model using the largest value.
The final value used for the model was mtry = 17.

24.4.1 Score Testing Set

probs <- predict(model_boot_rand , TEST,"prob")
class <- predict(model_boot_rand , TEST,"raw")

TEST.scored.boot <- cbind(TEST , probs, class )

24.5 Compare Grid-Search to Boosted

colnames(TEST.scored)
 [1] "ID"              "Diabetes"        "PhysActiveDays"  "SexOrientation" 
 [5] "SexNumPartYear"  "Marijuana"       "RegularMarij"    "AlcoholDay"     
 [9] "SexAge"          "SexNumPartnLife" "HardDrugs"       "SexEver"        
[13] "SameSex"         "AlcoholYear"     "LittleInterest"  "Depressed"      
[17] "Alcohol12PlusYr" "Education"       "MaritalStatus"   "Smoke100"       
[21] "Smoke100n"       "DaysPhysHlthBad" "DaysMentHlthBad" "HealthGen"      
[25] "SleepHrsNight"   "Work"            "SleepTrouble"    "BPSys1"         
[29] "BPDia1"          "Testosterone"    "PhysActive"      "BPSys2"         
[33] "BPDia2"          "UrineFlow1"      "BPSys3"          "BPDia3"         
[37] "DirectChol"      "TotChol"         "BPSysAve"        "BPDiaAve"       
[41] "Pulse"           "UrineVol1"       "HHIncome"        "HHIncomeMid"    
[45] "Poverty"         "BMI_WHO"         "AgeDecade"       "BMI"            
[49] "Height"          "TVHrsDay"        "CompHrsDay"      "Weight"         
[53] "HomeRooms"       "HomeOwn"         "SurveyYr"        "Gender"         
[57] "Age"             "Race1"           "Race3"           "No"             
[61] "Yes"             "class"          
colnames(TEST.scored.boot)
 [1] "ID"              "Diabetes"        "PhysActiveDays"  "SexOrientation" 
 [5] "SexNumPartYear"  "Marijuana"       "RegularMarij"    "AlcoholDay"     
 [9] "SexAge"          "SexNumPartnLife" "HardDrugs"       "SexEver"        
[13] "SameSex"         "AlcoholYear"     "LittleInterest"  "Depressed"      
[17] "Alcohol12PlusYr" "Education"       "MaritalStatus"   "Smoke100"       
[21] "Smoke100n"       "DaysPhysHlthBad" "DaysMentHlthBad" "HealthGen"      
[25] "SleepHrsNight"   "Work"            "SleepTrouble"    "BPSys1"         
[29] "BPDia1"          "Testosterone"    "PhysActive"      "BPSys2"         
[33] "BPDia2"          "UrineFlow1"      "BPSys3"          "BPDia3"         
[37] "DirectChol"      "TotChol"         "BPSysAve"        "BPDiaAve"       
[41] "Pulse"           "UrineVol1"       "HHIncome"        "HHIncomeMid"    
[45] "Poverty"         "BMI_WHO"         "AgeDecade"       "BMI"            
[49] "Height"          "TVHrsDay"        "CompHrsDay"      "Weight"         
[53] "HomeRooms"       "HomeOwn"         "SurveyYr"        "Gender"         
[57] "Age"             "Race1"           "Race3"           "No"             
[61] "Yes"             "class"          
test.model_cv_grid.score <- TEST.scored %>% 
  mutate(model="cv") 

test.model_boot_rand.score <- TEST.scored.boot %>%
  mutate(model='boot') 
  
stacked_df <- rbind(test.model_cv_grid.score, test.model_boot_rand.score)

library('yardstick')

Attaching package: 'yardstick'
The following objects are masked from 'package:caret':

    precision, recall, sensitivity, specificity
The following object is masked from 'package:readr':

    spec
roc_aucs <- stacked_df %>%
  group_by(model) %>%
  roc_auc(truth = Diabetes, Yes)

roc_aucs
# A tibble: 2 × 4
  model .metric .estimator .estimate
  <chr> <chr>   <chr>          <dbl>
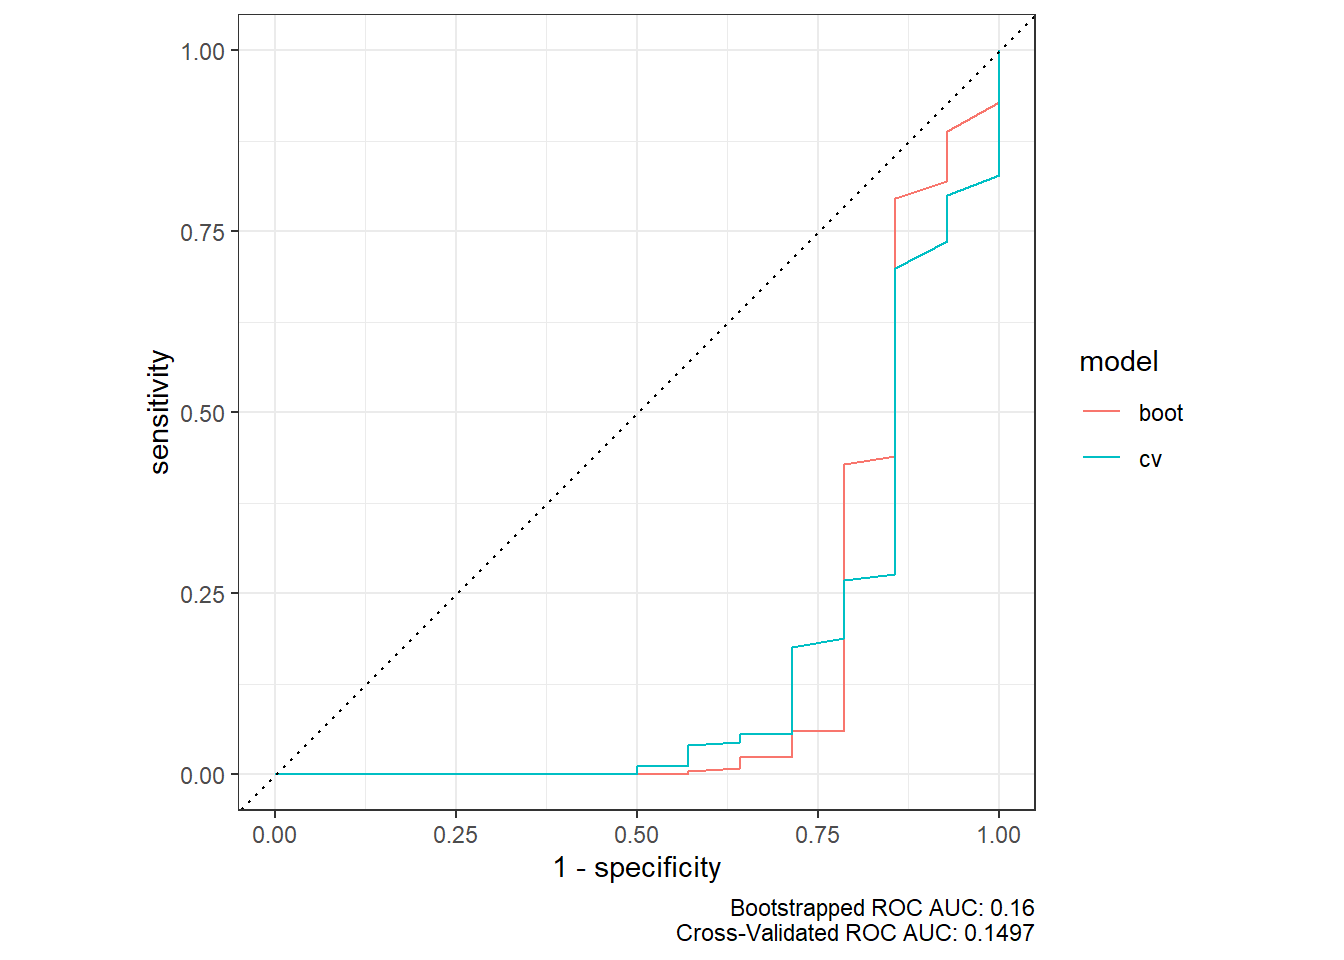
1 boot  roc_auc binary         0.16 
2 cv    roc_auc binary         0.150
boot_auc <- (roc_aucs %>% filter(model=='boot'))$.estimate
cv_auc <- (roc_aucs %>% filter(model=='cv'))$.estimate

roc_curves <- stacked_df %>%
  group_by(model) %>%
  roc_curve(truth = Diabetes, Yes)

autoplot(roc_curves) + 
  labs(caption = paste0("Bootstrapped ROC AUC: ", round(boot_auc,4),
                      "\nCross-Validated ROC AUC: ", round(cv_auc,4)))

confusion_matrices <- stacked_df %>%
  group_by(model) %>%
  conf_mat(truth =  Diabetes, class)

(confusion_matrices %>% filter(model == 'boot'))$conf_mat[[1]]
          Truth
Prediction  No Yes
       No  250   8
       Yes   0   6
(confusion_matrices %>% filter(model == 'cv'))$conf_mat[[1]]
          Truth
Prediction  No Yes
       No  250   8
       Yes   0   6
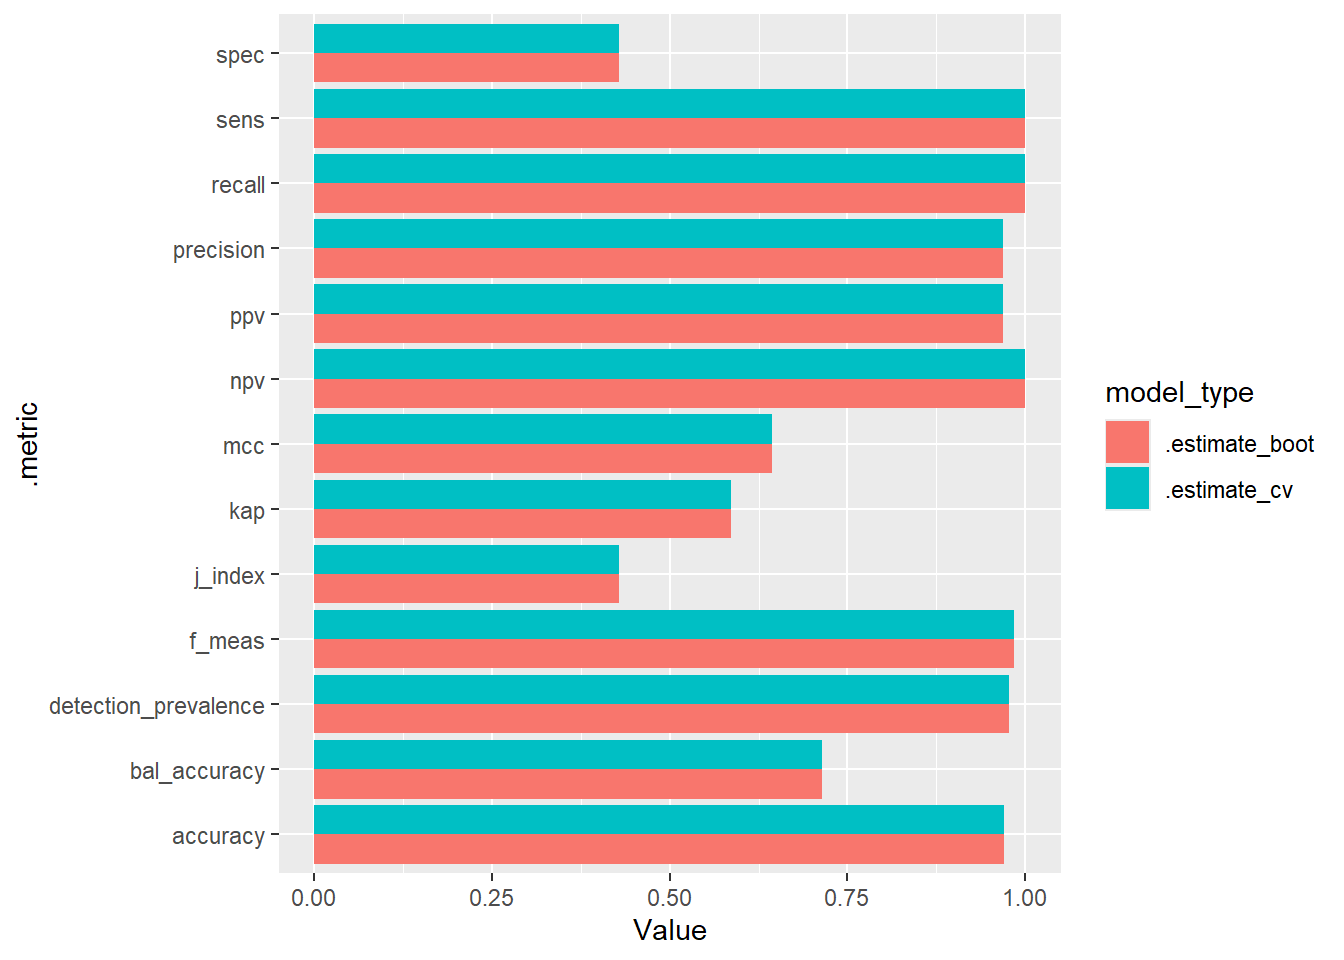
metrics_boots <- summary((confusion_matrices %>% filter(model == 'boot'))$conf_mat[[1]])  

metrics_cv <- summary((confusion_matrices %>% filter(model == 'cv'))$conf_mat[[1]])  

metrics_compare <- metrics_boots %>%
  left_join(metrics_cv, 
            by=c('.metric','.estimator'),
            suffix = c("_boot","_cv")) %>%
  gather(-.metric,-.estimator,key="model_type",value = Value)

ggplot(metrics_compare, aes(x=.metric, y=Value, fill=model_type)) +
  geom_bar(stat="identity", position=position_dodge()) + 
  coord_flip()

For more information on the caret package please see: http://topepo.github.io/caret/index.html