9  Exploratory Data Analysis at Scale

Code
Part4_Data <- here::here('DATA/Part_4')

library('kableExtra')
library('tidyverse')
── Attaching core tidyverse packages ──────────────────────── tidyverse 2.0.0 ──
✔ dplyr     1.1.4     ✔ readr     2.1.5
✔ forcats   1.0.0     ✔ stringr   1.5.1
✔ ggplot2   3.5.1     ✔ tibble    3.2.1
✔ lubridate 1.9.3     ✔ tidyr     1.3.1
✔ purrr     1.0.2     
── Conflicts ────────────────────────────────────────── tidyverse_conflicts() ──
✖ dplyr::filter()     masks stats::filter()
✖ dplyr::group_rows() masks kableExtra::group_rows()
✖ dplyr::lag()        masks stats::lag()
ℹ Use the conflicted package (<http://conflicted.r-lib.org/>) to force all conflicts to become errors
Code
A_DATA_2 <- readRDS(file.path(Part4_Data,'A_DATA_2.RDS'))

A_DATA_TBL_2.t_ks_result.furrr <- readRDS(file.path(Part4_Data,'A_DATA_TBL_2.t_ks_result.furrr.RDS'))

FEATURE_TYPE <- readRDS(file.path(Part4_Data,'FEATURE_TYPE.RDS'))

numeric_features <- FEATURE_TYPE$numeric_features
categorical_features <- FEATURE_TYPE$categorical_features

9.1 Investigate Results

We can make make our results scroll-able if we use kableExtra:

Code
A_DATA_TBL_2.t_ks_result.furrr %>%
  select(Feature, mean_diff_est , ttest.pvalue, kstest.pvalue, N_Target, mean_Target, sd_Target, N_Control, mean_Control, sd_Control) %>%
  mutate(across(where(is.numeric), round, 3))  %>%
  kableExtra::kbl() %>% # kableExtra from here down
  kable_paper() %>%
  scroll_box(width = "100%", height = "200px")
Warning: There was 1 warning in `mutate()`.
ℹ In argument: `across(where(is.numeric), round, 3)`.
Caused by warning:
! The `...` argument of `across()` is deprecated as of dplyr 1.1.0.
Supply arguments directly to `.fns` through an anonymous function instead.

  # Previously
  across(a:b, mean, na.rm = TRUE)

  # Now
  across(a:b, \(x) mean(x, na.rm = TRUE))
Feature mean_diff_est ttest.pvalue kstest.pvalue N_Target mean_Target sd_Target N_Control mean_Control sd_Control
PHAFSTHR 0.403 0.000 0.000 2002 11.331 3.756 17227 10.928 3.542
BPXML1 15.089 0.000 0.000 6212 160.122 26.533 66292 145.032 22.621
PHAFSTMN 0.210 0.607 0.953 2002 29.980 17.260 17227 29.770 17.302
BPXDI4 0.966 0.223 0.039 665 67.738 19.806 7687 66.772 16.984
BPXPLS -0.084 0.625 0.286 6246 74.368 13.046 66470 74.452 12.639
BPXDI1 2.029 0.000 0.000 5749 68.184 14.977 61757 66.156 14.895
BPXDI3 1.496 0.000 0.000 5740 67.521 15.235 60517 66.024 15.184
BPXDI2 1.964 0.000 0.000 5810 68.058 14.962 61041 66.094 14.996
BPXSY4 16.500 0.000 0.000 665 135.919 23.407 7687 119.419 20.331
BPXCHR -3.384 0.519 0.817 15 96.933 19.783 15152 100.317 17.076
BPXSY3 13.999 0.000 0.000 5740 131.256 20.739 60518 117.258 18.055
Age 31.486 0.000 0.000 6807 61.527 14.780 88740 30.041 23.635
BPXSY2 14.419 0.000 0.000 5810 132.280 21.146 61041 117.860 18.455
BPXSY1 14.842 0.000 0.000 5749 133.321 21.342 61757 118.478 18.858
BPXDAR 0.835 0.069 0.016 1356 66.953 16.481 20711 66.118 14.444
BMXHEAD NaN NA NA 0 NaN NA 0 NaN NA
LBDHDD -5.268 0.000 0.000 4704 48.553 14.488 45568 53.821 15.288
LBDHDDSI -0.136 0.000 0.000 4704 1.256 0.375 45568 1.392 0.395
BPXSAR 16.998 0.000 0.000 1356 134.541 22.248 20711 117.542 19.343
LBXAPB 7.345 0.000 0.001 228 101.175 28.270 2837 93.830 28.515
LBDAPBSI 0.073 0.000 0.001 228 1.012 0.283 2837 0.938 0.285
LBDLDLM -8.538 0.000 0.000 381 100.360 38.142 2167 108.898 35.153
LBDLDMSI -0.221 0.000 0.000 381 2.595 0.986 2167 2.816 0.909
LBDLDLN -10.763 0.000 0.000 385 99.764 38.508 2182 110.527 35.851
LBDLDNSI -0.278 0.000 0.000 385 2.580 0.996 2182 2.858 0.927
BMXSAD3 3.322 0.000 0.000 126 25.225 4.049 960 21.904 5.050
BMXSAD4 3.312 0.000 0.000 126 25.214 3.995 960 21.903 5.053
LBDLDL -9.006 0.000 0.000 2180 100.390 36.569 18145 109.396 35.225
LBDLDLSI -0.233 0.000 0.000 2180 2.596 0.946 18145 2.829 0.911
BMXSAD1 5.005 0.000 0.000 1923 25.616 4.551 18661 20.610 4.732
BMXSAD2 5.018 0.000 0.000 1923 25.612 4.570 18661 20.594 4.741
BMDAVSAD 5.005 0.000 0.000 1923 25.624 4.558 18661 20.619 4.734
BMXLEG -1.397 0.000 0.000 5857 37.535 4.280 65870 38.932 4.238
LBXTC -1.827 0.009 0.000 4704 181.063 46.312 45567 182.890 41.105
LBDTCSI -0.047 0.009 0.000 4704 4.682 1.198 45567 4.730 1.063
LBXGLU 60.692 0.000 0.000 2352 160.710 68.044 18897 100.018 18.194
BMXCALF 1.379 0.000 0.000 1811 38.211 4.791 27783 36.832 5.016
BMXARML 4.123 0.000 0.000 6057 37.580 2.993 81107 33.457 6.720
BMXSUB 7.916 0.000 0.000 2175 23.325 7.689 44885 15.409 8.668
URXUCR2 -42.900 0.000 0.000 636 94.338 56.189 6600 137.238 73.324
URDUCR2S -3792.372 0.000 0.000 636 8339.484 4967.065 6600 12131.855 6481.851
BMXTRI 4.759 0.000 0.000 2843 21.026 8.490 48206 16.267 8.204
BMXARMC 6.334 0.000 0.000 6054 34.672 5.408 81091 28.338 7.442
Poverty_Income_Ratio -0.072 0.000 0.000 6059 2.225 1.502 80794 2.296 1.610
BMAEXLEN 22.610 0.000 0.000 450 286.258 93.019 8321 263.647 79.125
URXUCR -11.888 0.000 0.000 4840 113.749 71.374 49920 125.637 81.455
BMXTHICR 1.186 0.000 0.000 1742 52.439 7.866 27456 51.253 8.012
LBDGLUSI 3.369 0.000 0.000 2352 8.921 3.777 18897 5.552 1.010
LBXTR 43.659 0.000 0.000 2260 157.202 159.082 18367 113.543 93.182
LBDTRSI 0.493 0.000 0.000 2260 1.775 1.796 18367 1.282 1.052
BMXRECUM -0.479 0.912 0.944 5 89.640 9.141 7205 90.119 8.600
URXUMA2 39.630 0.000 0.000 636 55.181 209.726 6600 15.550 77.535
URDUMA2S 39.630 0.000 0.000 636 55.181 209.726 6600 15.550 77.535
BMXHIP 6.579 0.000 0.000 773 110.892 15.731 5098 104.313 14.460
URXCRS -1050.899 0.000 0.000 4840 10055.402 6309.499 49920 11106.301 7200.588
BMXHT 10.458 0.000 0.000 6322 165.672 10.725 80726 155.214 23.879
BMXWAIST 23.277 0.000 0.000 5913 108.049 16.341 77653 84.773 21.414
PEASCTM1 149.680 0.000 0.000 4674 711.582 200.877 67355 561.902 267.205
URDACT2 88.039 0.000 0.000 636 102.720 580.014 6600 14.680 93.315
BMXWT 25.929 0.000 0.000 6306 88.116 23.925 83464 62.187 29.774
URXUMA 141.019 0.000 0.000 4840 172.300 793.228 49919 31.281 200.764
URXUMS 141.019 0.000 0.000 4840 172.300 793.228 49919 31.281 200.764
LBXIN 7.997 0.000 0.000 2284 21.110 35.946 18490 13.113 12.496
LBDINSI 47.984 0.000 0.000 2284 126.662 215.673 18490 78.678 74.976
BMXBMI 7.043 0.000 0.000 6268 31.948 7.566 80343 24.905 7.355
URDACT 141.427 0.000 0.000 3660 171.371 719.616 35584 29.944 532.255
WTSAF2YR -19537.782 0.000 0.000 2474 61002.970 68801.008 20100 80540.753 82941.640

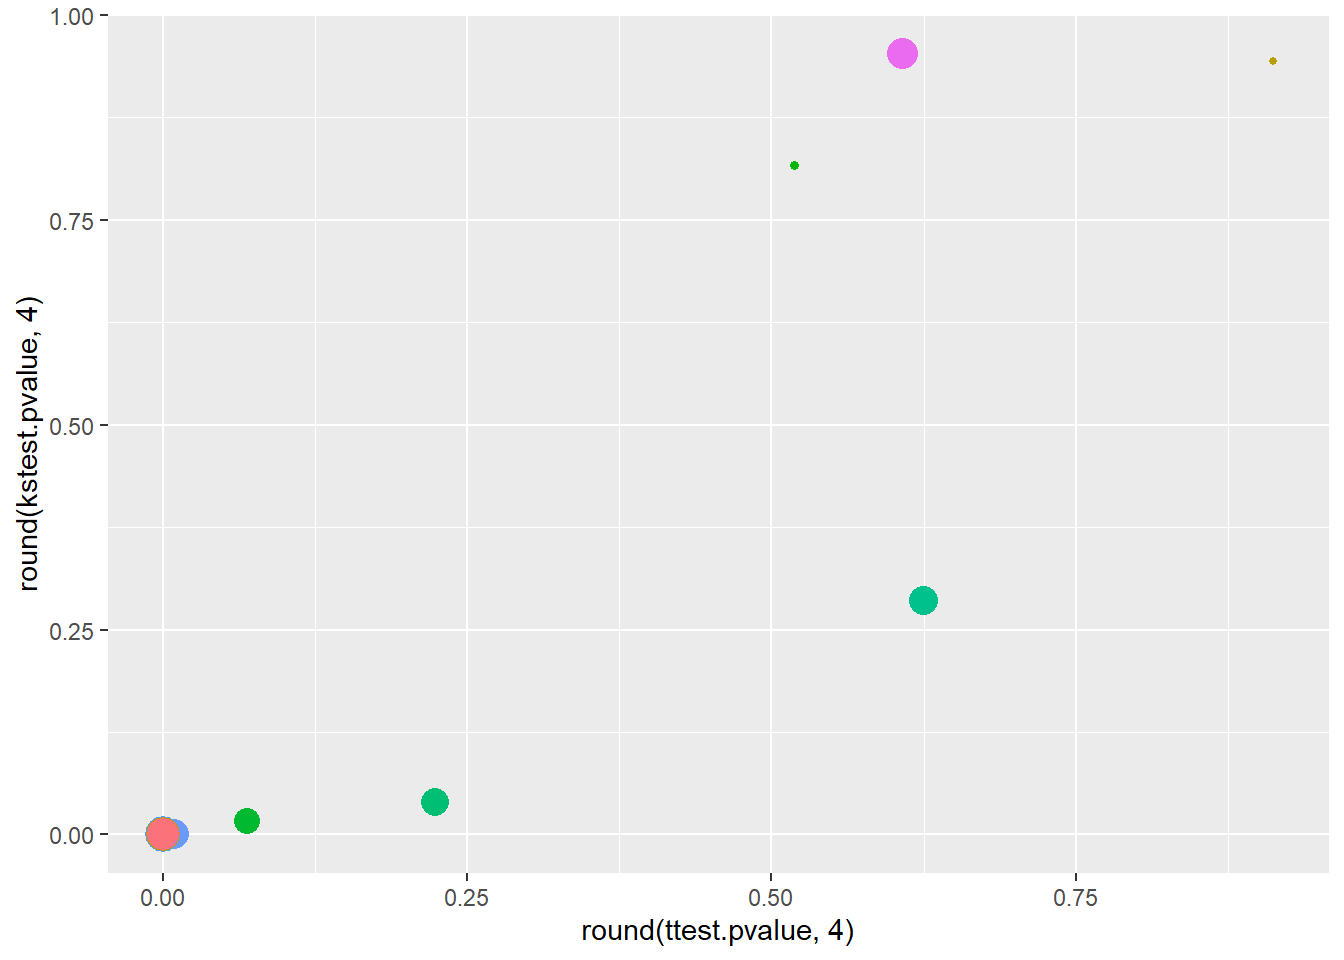
We can make a corresponding plot to go along with our table:

Code
plot <- A_DATA_TBL_2.t_ks_result.furrr %>%
  mutate(Feature_Prevalence_Pct = round(N_Target/(N_Target+N_Control)*100,2)) %>%
  ggplot(aes(x=round(ttest.pvalue,4) , y= round(kstest.pvalue,4), color = Feature, size = Feature_Prevalence_Pct)) +
  geom_point() + 
  theme(legend.position='none') 

plot
Warning: Removed 1 row containing missing values or values outside the scale range
(`geom_point()`).

9.2 tableby

The arsenal package also contains other helpful functions in terms of Exploratory Data Analysis:

Code

Attaching package: 'arsenal'
The following object is masked from 'package:lubridate':

    is.Date
Code
library('knitr')


A_DATA_2 %>%
  head()
# A tibble: 6 × 133
   SEQN DIABETES AGE_AT_DIAG_DM2   Age Gender Race  USAF  Birth_Country
  <dbl>    <dbl>           <dbl> <dbl> <chr>  <chr> <chr> <chr>        
1     1        0              NA     2 Female Black <NA>  USA          
2     2        0              NA    77 Male   White Yes   USA          
3     3        0              NA    10 Female White <NA>  <NA>         
4     4        0              NA     1 Male   Black <NA>  USA          
5     5        0              NA    49 Male   White Yes   USA          
6     6        0              NA    19 Female Other No    USA          
# ℹ 125 more variables: Grade_Level <chr>, Grade_Range <chr>,
#   Marital_Status <chr>, Pregnant <chr>, Household_Icome <chr>,
#   Family_Income <chr>, Poverty_Income_Ratio <dbl>, yr_range <chr>,
#   PEASCST1 <dbl>, PEASCTM1 <dbl>, PEASCCT1 <dbl>, BPXCHR <dbl>,
#   BPQ150A <dbl>, BPQ150B <dbl>, BPQ150C <dbl>, BPQ150D <dbl>, BPAARM <dbl>,
#   BPACSZ <dbl>, BPXPLS <dbl>, BPXDB <dbl>, BPXPULS <dbl>, BPXPTY <dbl>,
#   BPXML1 <dbl>, BPXSY1 <dbl>, BPXDI1 <dbl>, BPAEN1 <dbl>, BPXSY2 <dbl>, …

We can perform many of the analyses we did in the last part easily with the tableby function

Code
tableby(DIABETES_char ~ Age + Gender + Race + Marital_Status + Grade_Level + LBXGLU,
        data = A_DATA_2 %>%
          mutate(DIABETES_char = case_when(DIABETES == 1 ~ "Diabetics", 
                                   DIABETES == 0 ~ "Non-Diabetics",
                                   is.na(DIABETES) ~ "Unknown Diabetic Status"))) %>%
  summary(pfootnote=TRUE)
Diabetics (N=6807) Non-Diabetics (N=88740) Unknown Diabetic Status (N=5769) Total (N=101316) p value
Age < 0.0011
   Mean (SD) 61.527 (14.780) 30.041 (23.635) 11.989 (24.525) 31.128 (24.943)
   Range 1.000 - 85.000 1.000 - 85.000 0.000 - 85.000 0.000 - 85.000
Gender 0.0192
   Female 3371 (49.5%) 45188 (50.9%) 2864 (49.6%) 51423 (50.8%)
   Male 3436 (50.5%) 43552 (49.1%) 2905 (50.4%) 49893 (49.2%)
Race < 0.0012
   Black 1823 (26.8%) 20692 (23.3%) 1129 (19.6%) 23644 (23.3%)
   Mexican American 1373 (20.2%) 19426 (21.9%) 1650 (28.6%) 22449 (22.2%)
   Other 611 (9.0%) 8376 (9.4%) 510 (8.8%) 9497 (9.4%)
   Other Hispanic 592 (8.7%) 7201 (8.1%) 501 (8.7%) 8294 (8.2%)
   White 2408 (35.4%) 33045 (37.2%) 1979 (34.3%) 37432 (36.9%)
Marital_Status < 0.0012
   N-Miss 157 35025 4620 39802
   Divorced 838 (12.6%) 4599 (8.6%) 162 (14.1%) 5599 (9.1%)
   Living with partner 224 (3.4%) 3892 (7.2%) 70 (6.1%) 4186 (6.8%)
   Married 3634 (54.6%) 24349 (45.3%) 595 (51.8%) 28578 (46.5%)
   Never married 604 (9.1%) 15531 (28.9%) 137 (11.9%) 16272 (26.5%)
   Separated 253 (3.8%) 1541 (2.9%) 39 (3.4%) 1833 (3.0%)
   Widowed 1097 (16.5%) 3803 (7.1%) 146 (12.7%) 5046 (8.2%)
Grade_Level 0.0402
   N-Miss 6681 59497 5663 71841
   10th grade 11 (8.7%) 2177 (7.4%) 9 (8.5%) 2197 (7.5%)
   11th grade 12 (9.5%) 2146 (7.3%) 8 (7.5%) 2166 (7.3%)
   12th grade, no diploma 0 (0.0%) 438 (1.5%) 2 (1.9%) 440 (1.5%)
   1st grade 6 (4.8%) 2126 (7.3%) 2 (1.9%) 2134 (7.2%)
   2nd grade 4 (3.2%) 2102 (7.2%) 1 (0.9%) 2107 (7.1%)
   3rd grade 6 (4.8%) 2031 (6.9%) 6 (5.7%) 2043 (6.9%)
   4th grade 6 (4.8%) 2036 (7.0%) 12 (11.3%) 2054 (7.0%)
   5th grade 9 (7.1%) 2110 (7.2%) 10 (9.4%) 2129 (7.2%)
   6th grade 14 (11.1%) 2219 (7.6%) 5 (4.7%) 2238 (7.6%)
   7th grade 8 (6.3%) 2178 (7.4%) 11 (10.4%) 2197 (7.5%)
   8th grade 11 (8.7%) 2292 (7.8%) 12 (11.3%) 2315 (7.9%)
   9th grade 18 (14.3%) 2195 (7.5%) 15 (14.2%) 2228 (7.6%)
   Don’t Know 0 (0.0%) 9 (0.0%) 0 (0.0%) 9 (0.0%)
   GED or equivalent 0 (0.0%) 115 (0.4%) 0 (0.0%) 115 (0.4%)
   High school graduate 9 (7.1%) 1422 (4.9%) 7 (6.6%) 1438 (4.9%)
   Less than 5th grade 0 (0.0%) 26 (0.1%) 0 (0.0%) 26 (0.1%)
   Less than 9th grade 1 (0.8%) 277 (0.9%) 1 (0.9%) 279 (0.9%)
   More than high school 6 (4.8%) 980 (3.4%) 3 (2.8%) 989 (3.4%)
   Never attended / kindergarten only 5 (4.0%) 2362 (8.1%) 2 (1.9%) 2369 (8.0%)
   Refused 0 (0.0%) 2 (0.0%) 0 (0.0%) 2 (0.0%)
LBXGLU < 0.0011
   N-Miss 4455 69843 5326 79624
   Mean (SD) 160.710 (68.044) 100.018 (18.194) 118.363 (36.091) 106.974 (34.273)
   Range 21.000 - 584.000 38.000 - 422.000 77.000 - 451.000 21.000 - 584.000
  1. Linear Model ANOVA
  2. Pearson’s Chi-squared test

9.3 Assessing Cohort Balance

Let’s assume there was a cohort assigned to the patient, we can take our algorithm from Section Section 7.2

Code
set.seed(8576309)

A_DATA_2$rand_class <- sample(c('Rand_A','Rand_B'), 
                            size = nrow(A_DATA_2),  
                            replace = TRUE)

A_DATA_2$rand_sort <- runif(nrow(A_DATA_2))

A_DATA_2 <- A_DATA_2 %>%
  arrange(rand_sort) %>%
  mutate(rn = row_number()) %>%
  mutate(rn_mod_5 = rn %% 5 ) %>% 
  mutate(rand_class = if_else( rn_mod_5 == 0, 
                              "Rand_C", 
                              rand_class)) %>%
  select(-rn, -rn_mod_5, -rand_sort) %>%
  mutate(rand_class = as.factor(rand_class))

We can check for balance in the cohorts among some of the features perhaps, Age, Race, and Gender with:

Code
tableby(rand_class ~ Age + Gender + Race, 
        data = A_DATA_2) %>%
  summary(pfootnote=TRUE)
Rand_A (N=40534) Rand_B (N=40519) Rand_C (N=20263) Total (N=101316) p value
Age 0.0801
   Mean (SD) 31.336 (25.036) 30.947 (24.864) 31.075 (24.913) 31.128 (24.943)
   Range 0.000 - 85.000 0.000 - 85.000 0.000 - 85.000 0.000 - 85.000
Gender 0.5272
   Female 20602 (50.8%) 20484 (50.6%) 10337 (51.0%) 51423 (50.8%)
   Male 19932 (49.2%) 20035 (49.4%) 9926 (49.0%) 49893 (49.2%)
Race 0.6132
   Black 9464 (23.3%) 9484 (23.4%) 4696 (23.2%) 23644 (23.3%)
   Mexican American 8923 (22.0%) 8988 (22.2%) 4538 (22.4%) 22449 (22.2%)
   Other 3839 (9.5%) 3788 (9.3%) 1870 (9.2%) 9497 (9.4%)
   Other Hispanic 3399 (8.4%) 3278 (8.1%) 1617 (8.0%) 8294 (8.2%)
   White 14909 (36.8%) 14981 (37.0%) 7542 (37.2%) 37432 (36.9%)
  1. Linear Model ANOVA
  2. Pearson’s Chi-squared test

Above we see that both p-values of Race, and Gender are above .05 meaning the distributions of Race, and Gender appear to be random among the cohorts of rand_class; so here, the cohorts rand_class are well-balanced on Race, and Gender.

We see that the p-value of Age appears to be significant, however, the distributions appear to be similar:

Code
A_DATA_2 %>%
  ggplot(aes(x=Age, color=rand_class)) +
  geom_density()

9.4 Missing Data

Code
A_DATA_2.Num <- A_DATA_2 %>%
  select(SEQN, DIABETES, Gender, Race, Family_Income, all_of(FEATURE_TYPE$numeric_features))  

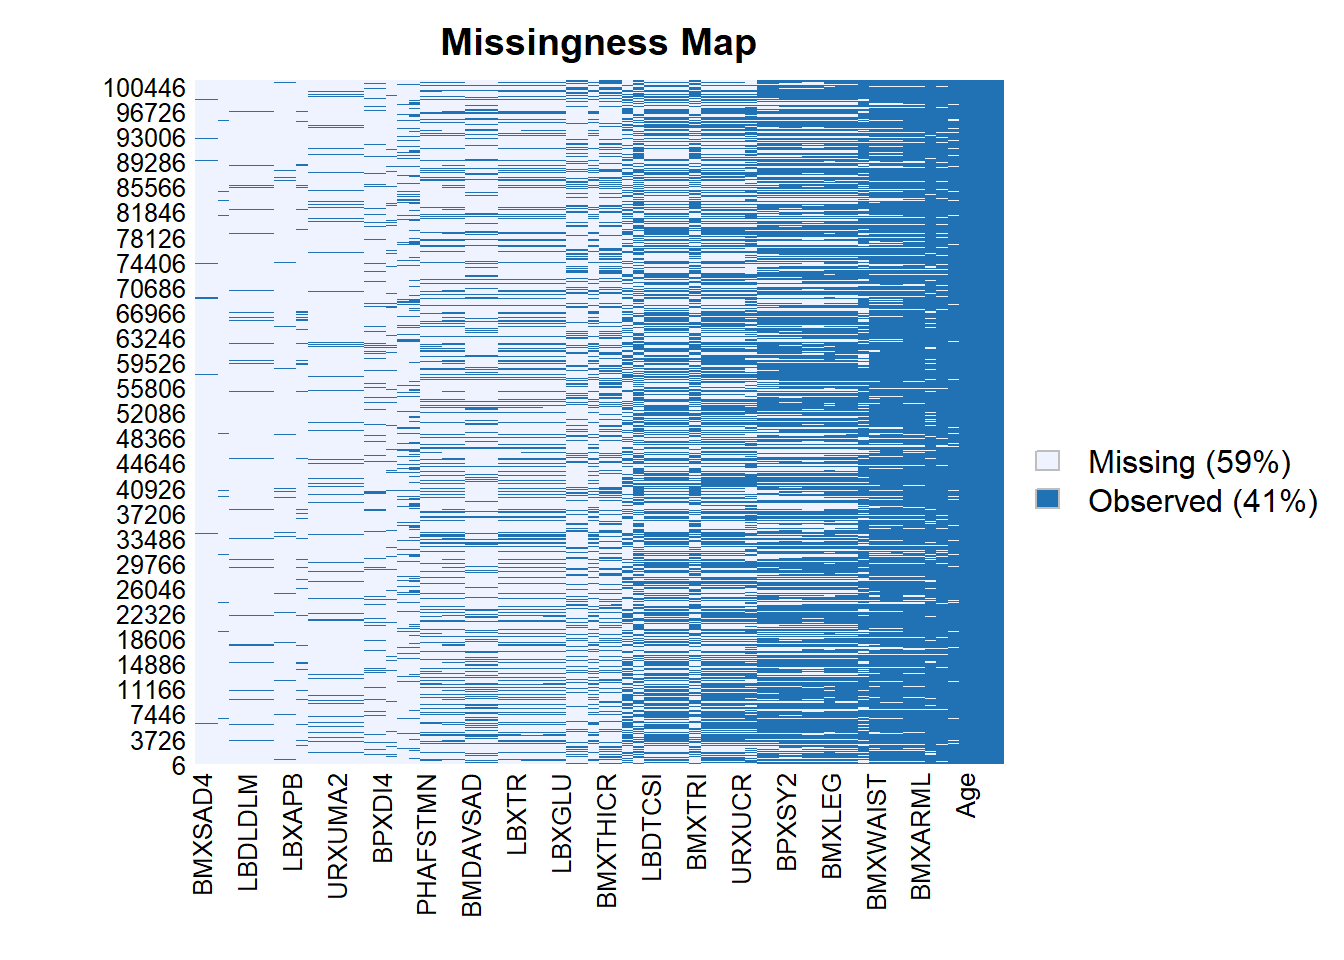
The first function is the Amelia::missmap function which can be used as follows.

Code
tic <- Sys.time()

Amelia::missmap(as.data.frame(A_DATA_2.Num))

Code
toc <- Sys.time()

time.Amelia <- difftime(toc , tic , units = "secs") 

Next we will review some of the functionality within the mice package:

Code

Attaching package: 'mice'
The following object is masked from 'package:stats':

    filter
The following objects are masked from 'package:base':

    cbind, rbind
Code
Loading required package: colorspace
Loading required package: grid
VIM is ready to use.
Suggestions and bug-reports can be submitted at: https://github.com/statistikat/VIM/issues

Attaching package: 'VIM'
The following object is masked from 'package:datasets':

    sleep
Code
Code
tic <- Sys.time()

#plot the missing values
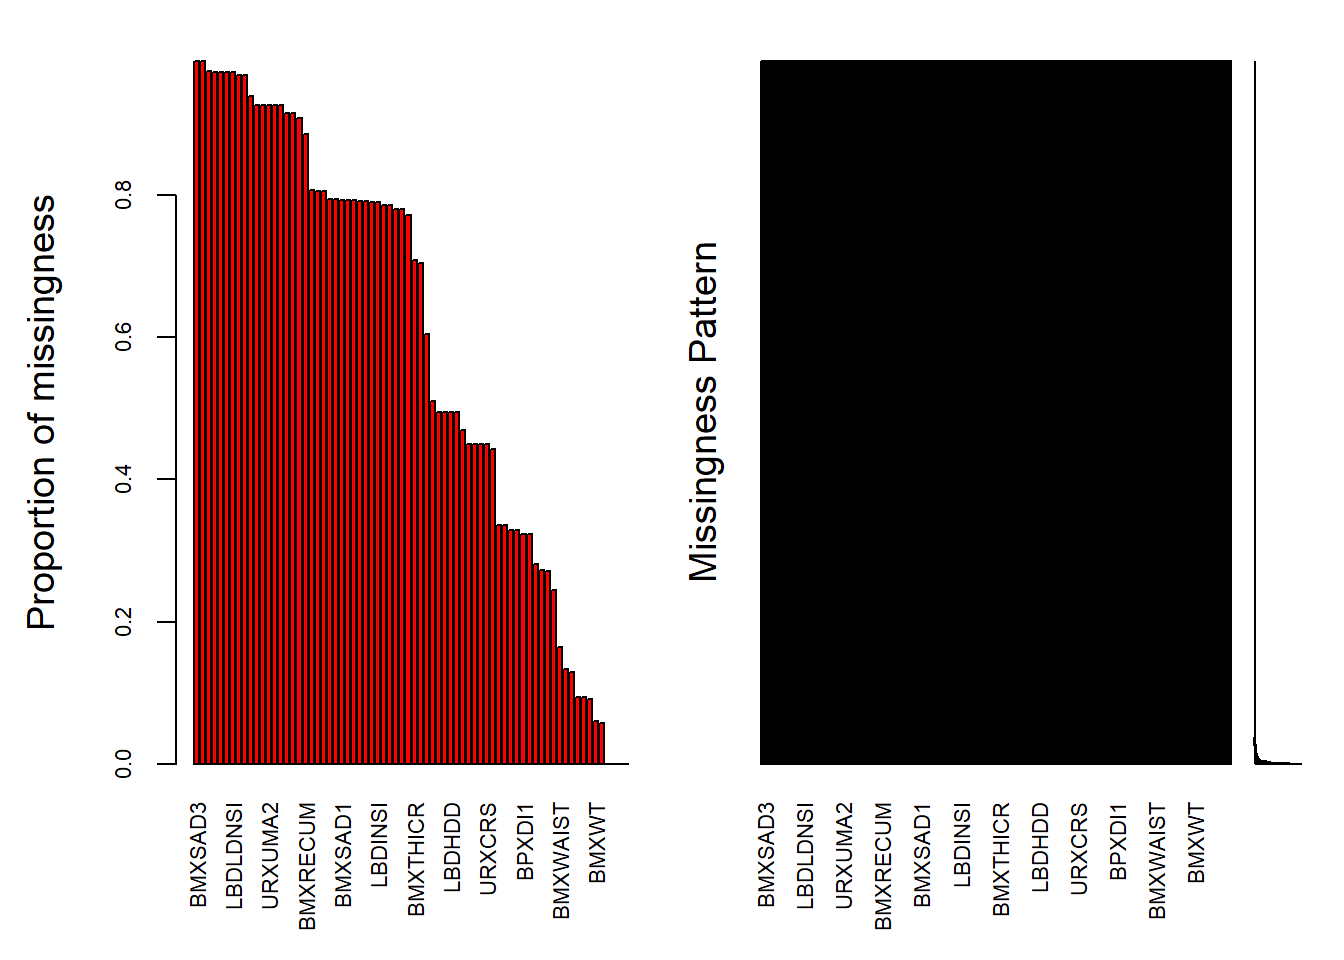
plot.miss <- aggr(A_DATA_2.Num,  
     numbers=TRUE, 
     sortVars=TRUE, 
     labels=colnames(A_DATA_2.Num), 
     cex.axis=.7, 
     gap=3, 
     ylab=c("Proportion of missingness","Missingness Pattern"))
Warning in plot.aggr(res, ...): not enough vertical space to display
frequencies (too many combinations)


 Variables sorted by number of missings: 
             Variable      Count
              BMXSAD3 0.98905405
              BMXSAD4 0.98905405
              BMXHEAD 0.97536421
              LBDLDLM 0.97403174
             LBDLDMSI 0.97403174
              LBDLDLN 0.97384421
             LBDLDNSI 0.97384421
               LBXAPB 0.96934344
             LBDAPBSI 0.96934344
               BMXHIP 0.94039441
              URXUCR2 0.92734612
             URDUCR2S 0.92734612
              URXUMA2 0.92734612
             URDUMA2S 0.92734612
              URDACT2 0.92734612
               BPXDI4 0.91643965
               BPXSY4 0.91643965
             BMAEXLEN 0.90838564
             BMXRECUM 0.88619764
               BPXCHR 0.80783884
             PHAFSTHR 0.80652612
             PHAFSTMN 0.80652612
               LBDLDL 0.79523471
             LBDLDLSI 0.79523471
              BMXSAD1 0.79276718
              BMXSAD2 0.79276718
             BMDAVSAD 0.79276718
                LBXTR 0.79212563
              LBDTRSI 0.79212563
                LBXIN 0.79067472
              LBDINSI 0.79067472
               LBXGLU 0.78589759
             LBDGLUSI 0.78589759
               BPXDAR 0.78019266
               BPXSAR 0.78019266
             WTSAF2YR 0.77256307
             BMXTHICR 0.70892060
              BMXCALF 0.70493308
               URDACT 0.60521537
               BMXSUB 0.50978128
                LBXTC 0.49466027
              LBDTCSI 0.49466027
               LBDHDD 0.49465040
             LBDHDDSI 0.49465040
               BMXTRI 0.46913617
               URXUMA 0.45004738
               URXUMS 0.45004738
               URXUCR 0.45003751
               URXCRS 0.45003751
        Family_Income 0.44252635
               BPXDI3 0.33547515
               BPXSY3 0.33546528
               BPXDI2 0.32948399
               BPXSY2 0.32948399
               BPXDI1 0.32314738
               BPXSY1 0.32314738
               BMXLEG 0.28113032
               BPXML1 0.27300722
               BPXPLS 0.27083580
             PEASCTM1 0.24495637
             BMXWAIST 0.16401161
               BMXBMI 0.13341427
                BMXHT 0.12907142
              BMXARMC 0.09402266
              BMXARML 0.09381539
 Poverty_Income_Ratio 0.09076553
                BMXWT 0.06054325
             DIABETES 0.05694066
                 SEQN 0.00000000
               Gender 0.00000000
                 Race 0.00000000
                  Age 0.00000000
Code
toc <- Sys.time()

time.mice <- difftime(toc , tic , units = "secs") 
Code
#Drawing margin plot
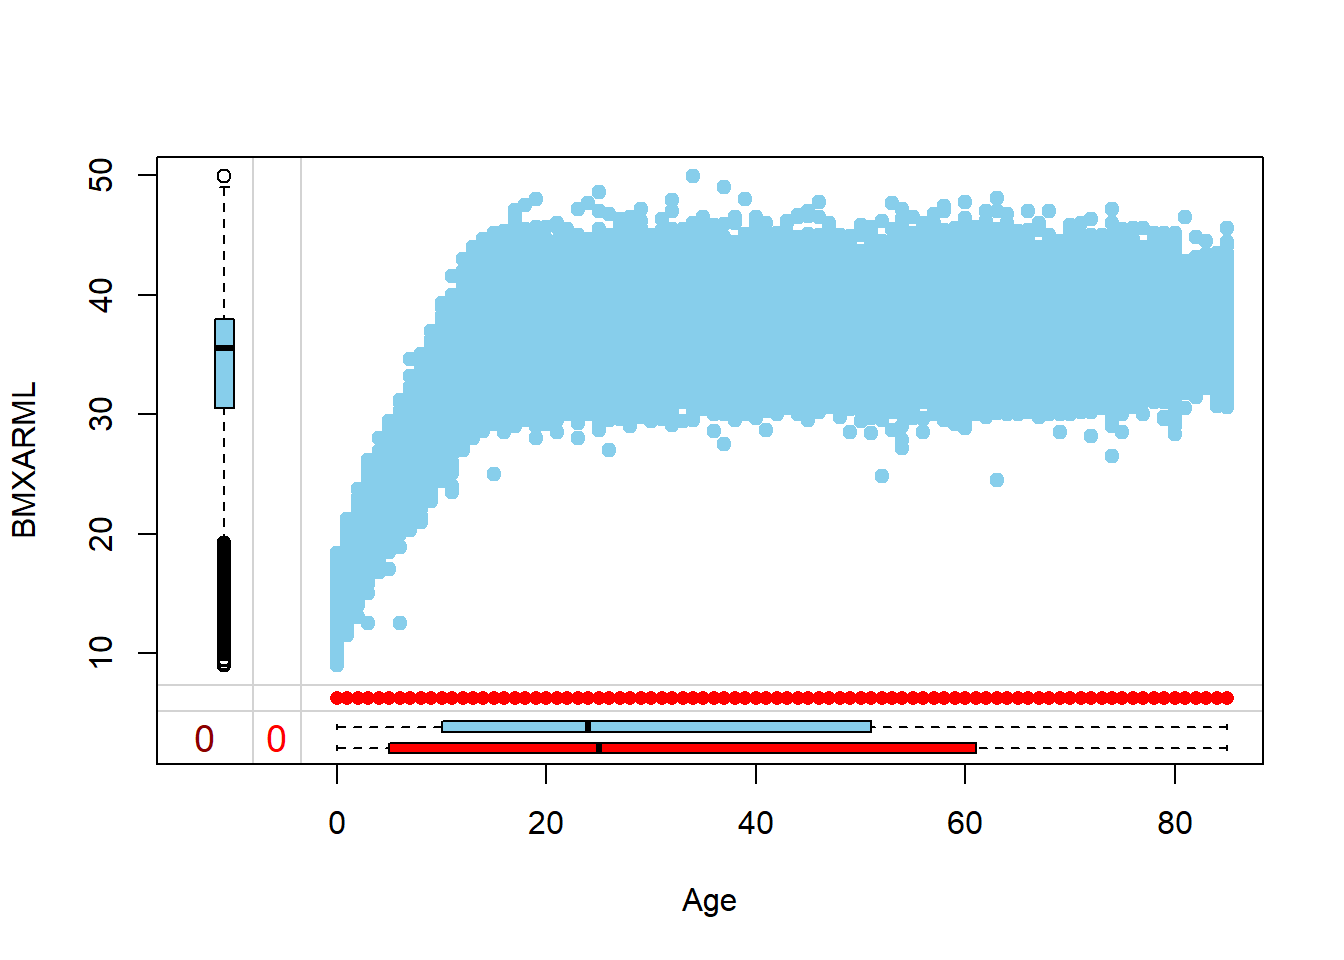
marginplot(A_DATA_2.Num[, c("Age", "BMXARML")], 
           cex.numbers = 1.2, 
           pch = 19)

Code
#Drawing margin plot
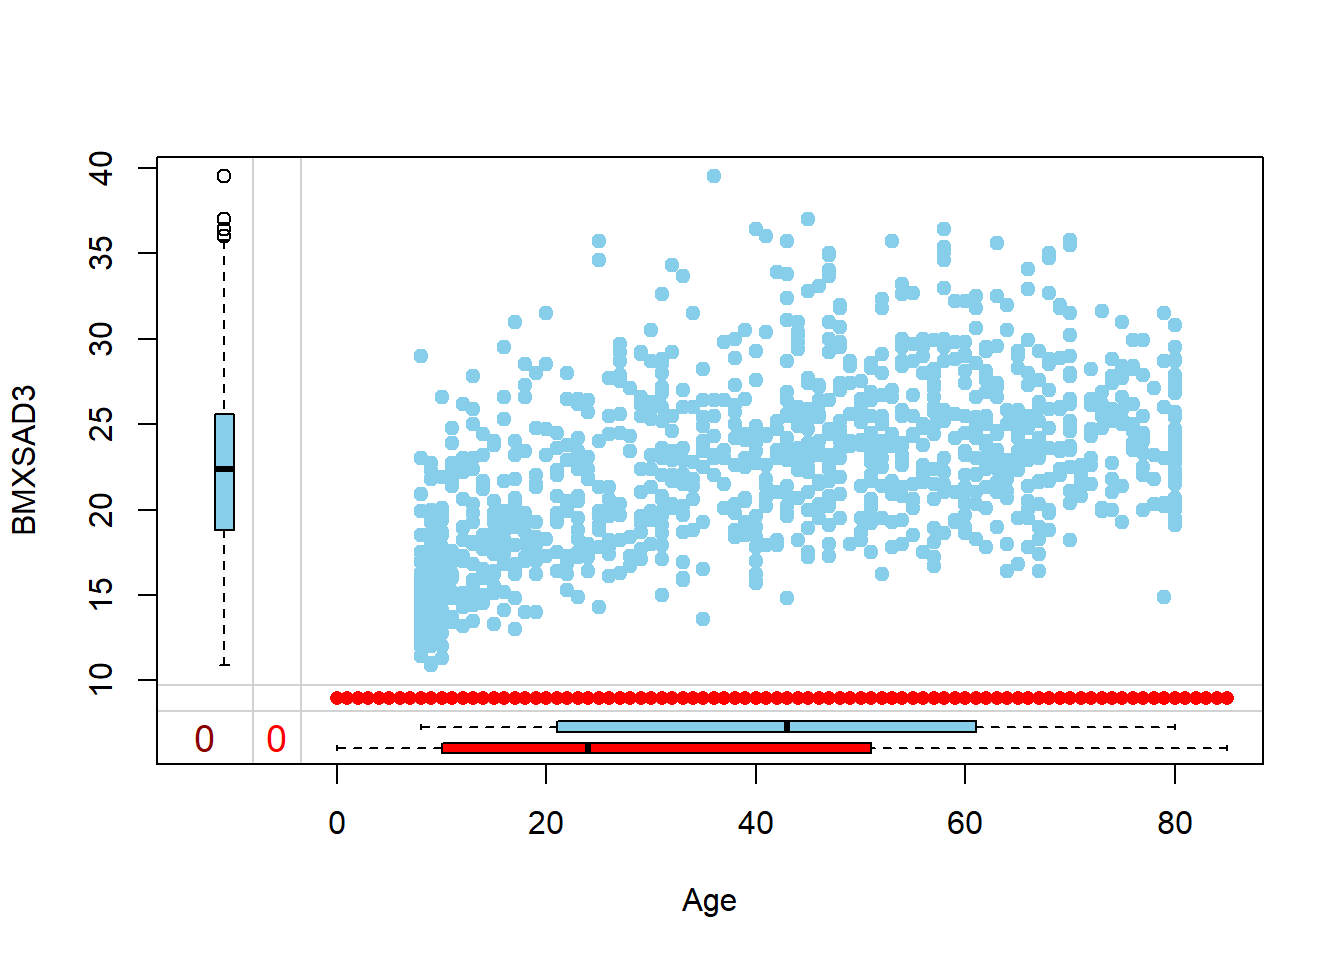
marginplot(A_DATA_2.Num[, c("Age", "BMXSAD3")], 
           cex.numbers = 1.2, 
           pch = 19)

Here’s a function to give to return the a tibble of features with percentage of non-missing values:

Code
Features_Percent_Complete <- function(data, Percent_Complete = 0){
  
  if(is.na(Percent_Complete)){Percent_Complete <- 0}   
  
  SumNa <- function(col){sum(is.na(col))}
  
  na_sums <- data %>% 
    summarise_all(SumNa) %>%
    tidyr::pivot_longer(everything() ,names_to = 'feature', values_to = 'SumNa') %>%
    arrange(-SumNa) %>%
    mutate(PctNa = SumNa/nrow(data)) %>%
    mutate(PctComp = (1 - PctNa)*100)
  
  data_out <- na_sums %>%
    filter(PctComp >= Percent_Complete)
  
return(data_out)
}

Let’s first define the features that have at least 70% data:

Code
features_all_percent_compete <- Features_Percent_Complete(A_DATA_2.Num, 0)

features_all_percent_compete
# A tibble: 72 × 4
   feature   SumNa PctNa PctComp
   <chr>     <int> <dbl>   <dbl>
 1 BMXSAD3  100207 0.989    1.09
 2 BMXSAD4  100207 0.989    1.09
 3 BMXHEAD   98820 0.975    2.46
 4 LBDLDLM   98685 0.974    2.60
 5 LBDLDMSI  98685 0.974    2.60
 6 LBDLDLN   98666 0.974    2.62
 7 LBDLDNSI  98666 0.974    2.62
 8 LBXAPB    98210 0.969    3.07
 9 LBDAPBSI  98210 0.969    3.07
10 BMXHIP    95277 0.940    5.96
# ℹ 62 more rows

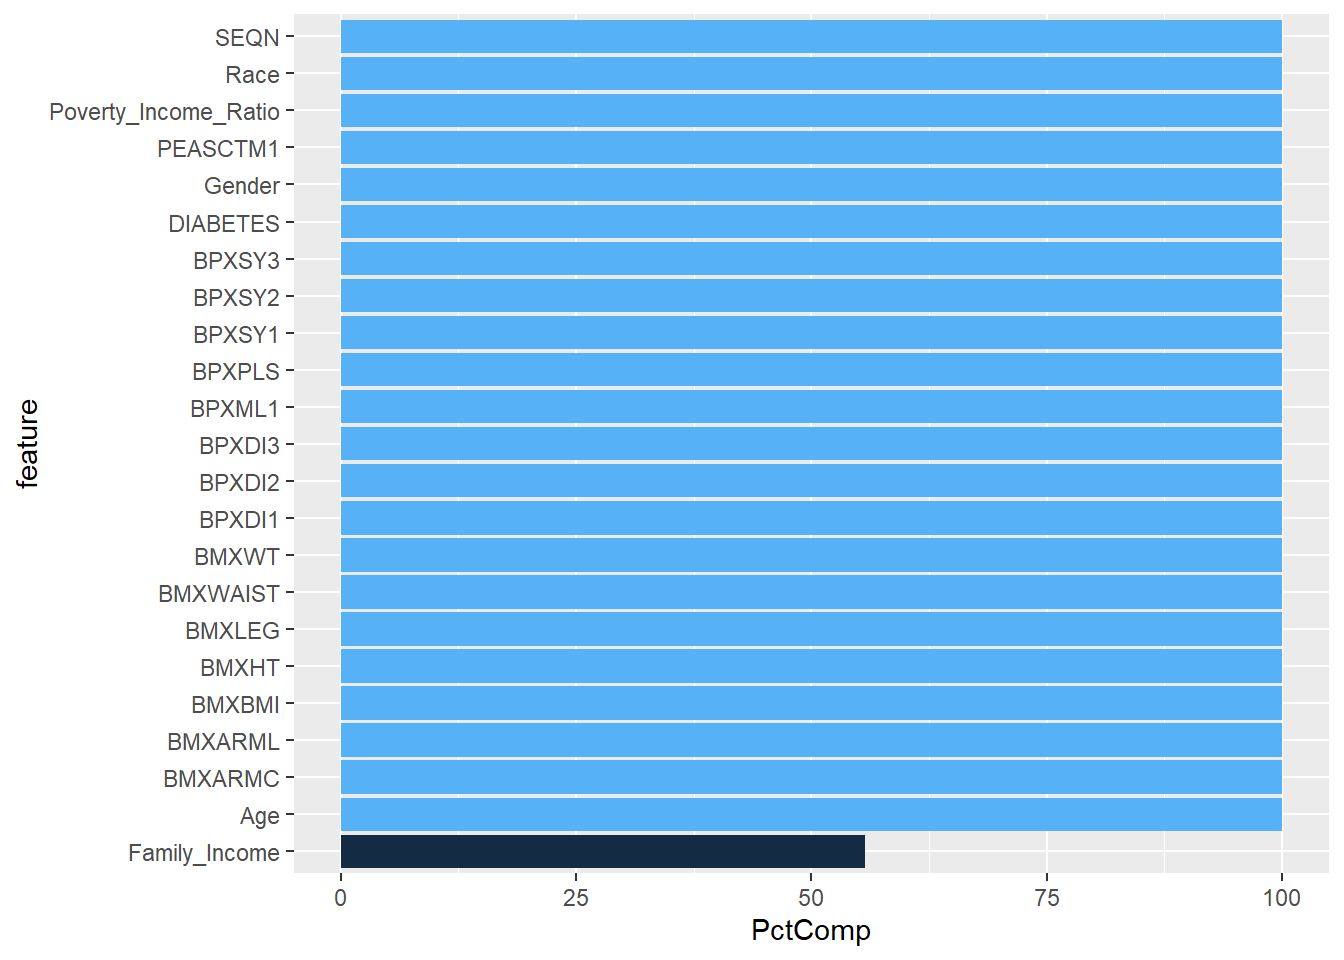
Then we can graph this as:

Code
features_all_percent_compete %>%
  ggplot(aes(x=reorder(feature, PctComp), y =PctComp, fill=PctComp)) +
  geom_bar(stat = "identity") +
  coord_flip() +
  theme(legend.position = "none") 

For the remainder of the majority of this discussion we’ll limit ourselves to features that have at least 65% of data:

Code
features_65_num <- Features_Percent_Complete(A_DATA_2.Num, 65) %>%
  filter(feature %in% c(FEATURE_TYPE$numeric_features) )

features_65_num
# A tibble: 18 × 4
   feature              SumNa  PctNa PctComp
   <chr>                <int>  <dbl>   <dbl>
 1 BPXDI3               33989 0.335     66.5
 2 BPXSY3               33988 0.335     66.5
 3 BPXDI2               33382 0.329     67.1
 4 BPXSY2               33382 0.329     67.1
 5 BPXDI1               32740 0.323     67.7
 6 BPXSY1               32740 0.323     67.7
 7 BMXLEG               28483 0.281     71.9
 8 BPXML1               27660 0.273     72.7
 9 BPXPLS               27440 0.271     72.9
10 PEASCTM1             24818 0.245     75.5
11 BMXWAIST             16617 0.164     83.6
12 BMXBMI               13517 0.133     86.7
13 BMXHT                13077 0.129     87.1
14 BMXARMC               9526 0.0940    90.6
15 BMXARML               9505 0.0938    90.6
16 Poverty_Income_Ratio  9196 0.0908    90.9
17 BMXWT                 6134 0.0605    93.9
18 Age                      0 0        100  

Note again we can make a function for this graph above:

Code
Feature_Percent_Complete_Graph <- function(data, Percent_Complete = 0 ){
  table <- Features_Percent_Complete(data, Percent_Complete)
  
  plot1 <- table %>%
    mutate(feature = reorder(feature, PctComp)) %>%
    ggplot(aes(x= feature, y =PctComp, fill=PctComp)) +
    geom_bar(stat = "identity") +
    coord_flip() +
    theme(legend.position = "none")
  return(plot1)
} 

Let’s time it:

Code
tic <- Sys.time()

Feature_Percent_Complete_Graph(A_DATA_2.Num, 0)

Code
toc <- Sys.time()

FPC.time <- difftime(toc , tic , units = 'secs')

9.4.0.1 Speed-Ups

Amelia is an older package, we can see that our function is

Code
as.numeric(time.Amelia) / as.numeric(FPC.time)
[1] 186.1856

times faster than Amelia::missmap

It also outperforms the mice results by:

Code
as.numeric(time.mice) / as.numeric(FPC.time)
[1] 142.3695

9.4.1 Missing Value Imputation

Note in the below summarise_at we are passing in a number of functions including a function to count the number of missing values n_miss, n, min, max, mean, median, and sd, these summary statistics are computed _at each of the vars we pass in:

Code
summary_table <- A_DATA_2.Num %>%
  filter(!is.na(DIABETES)) %>%
  group_by(Gender, Race, Family_Income) %>%
  summarise( # summarize the data
    across( # apply the following functions to the following columns
      all_of(features_65_num$feature), # select the columns
      list(  # list of functions to apply
        n = ~n(),
        n_miss = ~sum(is.na(.x)),
        min = ~min(.x , na.rm = TRUE),
        max = ~max(.x , na.rm = TRUE),
        mean = ~mean(.x , na.rm = TRUE),
        median = ~median(.x , na.rm = TRUE),
        sd = ~sd(.x , na.rm = TRUE)
        )
      ), # end of across
    .groups='keep' # keep is an option for summary functions
  ) # end of summarise
Warning: There were 40 warnings in `summarise()`.
The first warning was:
ℹ In argument: `across(...)`.
ℹ In group 6: `Gender = "Female"`, `Race = "Black"`, `Family_Income = "$20,000
  and Over"`.
Caused by warning in `min()`:
! no non-missing arguments to min; returning Inf
ℹ Run `dplyr::last_dplyr_warnings()` to see the 39 remaining warnings.
Code
summary_table %>%
  glimpse()
Rows: 150
Columns: 129
Groups: Gender, Race, Family_Income [150]
$ Gender                      <chr> "Female", "Female", "Female", "Female", "F…
$ Race                        <chr> "Black", "Black", "Black", "Black", "Black…
$ Family_Income               <chr> "$ 0 to $ 4,999", "$ 5,000 to $ 9,999", "$…
$ BPXDI3_n                    <int> 364, 459, 522, 541, 456, 171, 544, 827, 57…
$ BPXDI3_n_miss               <int> 110, 142, 155, 117, 136, 36, 134, 206, 138…
$ BPXDI3_min                  <dbl> 0, 0, 0, 0, 0, 0, 0, 0, 0, 0, 0, 0, 0, 26,…
$ BPXDI3_max                  <dbl> 116, 126, 112, 110, 108, 102, 112, 118, 11…
$ BPXDI3_mean                 <dbl> 65.09449, 67.35016, 64.74659, 65.93396, 66…
$ BPXDI3_median               <dbl> 66, 68, 66, 68, 68, 70, 66, 68, 66, 68, 68…
$ BPXDI3_sd                   <dbl> 16.55506, 17.14552, 16.63621, 15.14111, 16…
$ BPXSY3_n                    <int> 364, 459, 522, 541, 456, 171, 544, 827, 57…
$ BPXSY3_n_miss               <int> 110, 142, 155, 117, 136, 36, 134, 206, 138…
$ BPXSY3_min                  <dbl> 84, 82, 74, 82, 86, 80, 82, 80, 78, 82, 86…
$ BPXSY3_max                  <dbl> 224, 212, 218, 210, 196, 222, 212, 232, 20…
$ BPXSY3_mean                 <dbl> 117.7087, 123.9558, 122.2616, 116.7594, 12…
$ BPXSY3_median               <dbl> 114, 118, 116, 112, 116, 122, 114, 116, 11…
$ BPXSY3_sd                   <dbl> 19.76127, 23.39178, 23.76564, 18.70560, 20…
$ BPXDI2_n                    <int> 364, 459, 522, 541, 456, 171, 544, 827, 57…
$ BPXDI2_n_miss               <int> 114, 145, 160, 112, 129, 34, 126, 208, 138…
$ BPXDI2_min                  <dbl> 0, 0, 0, 0, 0, 0, 0, 0, 0, 0, 0, 0, 0, 36,…
$ BPXDI2_max                  <dbl> 126, 124, 110, 114, 110, 104, 108, 122, 11…
$ BPXDI2_mean                 <dbl> 65.25600, 67.51592, 65.16575, 66.54079, 66…
$ BPXDI2_median               <dbl> 66, 66, 66, 68, 68, 68, 66, 66, 66, 66, 66…
$ BPXDI2_sd                   <dbl> 15.90050, 16.45426, 16.46419, 14.67869, 16…
$ BPXSY2_n                    <int> 364, 459, 522, 541, 456, 171, 544, 827, 57…
$ BPXSY2_n_miss               <int> 114, 145, 160, 112, 129, 34, 126, 208, 138…
$ BPXSY2_min                  <dbl> 86, 86, 72, 80, 86, 84, 84, 84, 76, 82, 86…
$ BPXSY2_max                  <dbl> 190, 228, 212, 208, 194, 216, 210, 234, 20…
$ BPXSY2_mean                 <dbl> 117.6400, 125.1401, 123.3702, 117.6364, 12…
$ BPXSY2_median               <dbl> 114, 120, 116, 114, 116, 122, 114, 116, 11…
$ BPXSY2_sd                   <dbl> 19.00957, 23.64783, 23.73587, 18.99184, 21…
$ BPXDI1_n                    <int> 364, 459, 522, 541, 456, 171, 544, 827, 57…
$ BPXDI1_n_miss               <int> 113, 148, 163, 129, 139, 38, 138, 219, 145…
$ BPXDI1_min                  <dbl> 0, 0, 0, 0, 0, 0, 0, 0, 0, 0, 0, 0, 0, 42,…
$ BPXDI1_max                  <dbl> 124, 124, 106, 114, 104, 112, 116, 116, 11…
$ BPXDI1_mean                 <dbl> 66.28685, 68.47588, 65.14206, 66.51942, 66…
$ BPXDI1_median               <dbl> 66, 68, 66, 68, 68, 68, 66, 66, 66, 68, 68…
$ BPXDI1_sd                   <dbl> 14.07457, 15.88685, 15.49407, 13.23757, 15…
$ BPXSY1_n                    <int> 364, 459, 522, 541, 456, 171, 544, 827, 57…
$ BPXSY1_n_miss               <int> 113, 148, 163, 129, 139, 38, 138, 219, 145…
$ BPXSY1_min                  <dbl> 88, 80, 74, 82, 84, 84, 86, 84, 78, 84, 86…
$ BPXSY1_max                  <dbl> 208, 230, 220, 208, 198, 216, 222, 238, 20…
$ BPXSY1_mean                 <dbl> 117.8725, 125.1447, 122.8969, 117.5485, 12…
$ BPXSY1_median               <dbl> 114, 120, 118, 114, 116, 122, 114, 116, 11…
$ BPXSY1_sd                   <dbl> 19.40844, 24.38247, 23.34555, 18.58550, 21…
$ BMXLEG_n                    <int> 364, 459, 522, 541, 456, 171, 544, 827, 57…
$ BMXLEG_n_miss               <int> 116, 139, 165, 111, 134, 35, 126, 199, 129…
$ BMXLEG_min                  <dbl> 27.6, 27.7, 24.9, 27.1, 27.2, 29.8, 28.0, …
$ BMXLEG_max                  <dbl> 47.2, 46.8, 48.2, 48.5, 50.0, 45.0, 46.7, …
$ BMXLEG_mean                 <dbl> 38.63629, 38.14375, 37.86022, 38.96349, 37…
$ BMXLEG_median               <dbl> 38.95, 38.20, 38.00, 39.05, 38.00, 38.30, …
$ BMXLEG_sd                   <dbl> 3.544325, 3.598819, 3.773591, 3.155392, 3.…
$ BPXML1_n                    <int> 364, 459, 522, 541, 456, 171, 544, 827, 57…
$ BPXML1_n_miss               <int> 101, 130, 143, 104, 119, 31, 113, 184, 126…
$ BPXML1_min                  <dbl> 110, 0, 110, 100, 110, 120, 110, 110, 110,…
$ BPXML1_max                  <dbl> 240, 250, 888, 220, 220, 250, 888, 888, 24…
$ BPXML1_mean                 <dbl> 143.3840, 149.3617, 155.3879, 143.5515, 14…
$ BPXML1_median               <dbl> 140, 140, 140, 140, 140, 140, 140, 140, 14…
$ BPXML1_sd                   <dbl> 20.31134, 24.59216, 69.76214, 18.14822, 21…
$ BPXPLS_n                    <int> 364, 459, 522, 541, 456, 171, 544, 827, 57…
$ BPXPLS_n_miss               <int> 101, 131, 142, 104, 119, 31, 113, 183, 126…
$ BPXPLS_min                  <dbl> 50, 46, 46, 44, 46, 50, 46, 46, 50, 48, 36…
$ BPXPLS_max                  <dbl> 120, 116, 130, 120, 112, 110, 140, 118, 12…
$ BPXPLS_mean                 <dbl> 77.87072, 76.92073, 75.43684, 74.52174, 75…
$ BPXPLS_median               <dbl> 78, 76, 74, 74, 74, 74, 76, 76, 74, 74, 74…
$ BPXPLS_sd                   <dbl> 12.51924, 12.55665, 12.28718, 11.47804, 12…
$ PEASCTM1_n                  <int> 364, 459, 522, 541, 456, 171, 544, 827, 57…
$ PEASCTM1_n_miss             <int> 131, 145, 170, 229, 155, 48, 187, 294, 229…
$ PEASCTM1_min                <dbl> 6, 9, 6, 37, 7, 46, 8, 3, 7, 6, 5, 7, 6, 1…
$ PEASCTM1_max                <dbl> 1131, 1536, 1243, 1439, 1274, 1086, 1142, …
$ PEASCTM1_mean               <dbl> 543.7597, 563.0000, 554.6705, 637.6538, 55…
$ PEASCTM1_median             <dbl> 567.0, 576.5, 603.5, 657.5, 590.0, 667.0, …
$ PEASCTM1_sd                 <dbl> 248.5154, 272.9288, 271.9278, 245.9812, 25…
$ BMXWAIST_n                  <int> 364, 459, 522, 541, 456, 171, 544, 827, 57…
$ BMXWAIST_n_miss             <int> 59, 66, 79, 66, 55, 25, 73, 91, 55, 57, 26…
$ BMXWAIST_min                <dbl> 38.7, 43.3, 40.5, 46.2, 42.7, 43.9, 44.2, …
$ BMXWAIST_max                <dbl> 165.5, 171.6, 156.8, 163.5, 158.8, 151.7, …
$ BMXWAIST_mean               <dbl> 83.58656, 89.62290, 88.33115, 89.26379, 84…
$ BMXWAIST_median             <dbl> 80.80, 90.20, 91.60, 89.40, 86.70, 99.60, …
$ BMXWAIST_sd                 <dbl> 25.32800, 26.69575, 25.81373, 21.50595, 24…
$ BMXBMI_n                    <int> 364, 459, 522, 541, 456, 171, 544, 827, 57…
$ BMXBMI_n_miss               <int> 37, 36, 45, 42, 32, 15, 39, 59, 36, 32, 11…
$ BMXBMI_min                  <dbl> 13.40, 12.50, 13.41, 13.40, 12.70, 13.30, …
$ BMXBMI_max                  <dbl> 57.80, 82.10, 77.50, 68.70, 84.40, 64.70, …
$ BMXBMI_mean                 <dbl> 26.12003, 27.81638, 27.77199, 27.98603, 26…
$ BMXBMI_median               <dbl> 23.700, 26.660, 27.230, 26.900, 25.500, 30…
$ BMXBMI_sd                   <dbl> 9.509575, 10.418529, 9.889805, 8.842373, 9…
$ BMXHT_n                     <int> 364, 459, 522, 541, 456, 171, 544, 827, 57…
$ BMXHT_n_miss                <int> 36, 36, 44, 42, 32, 14, 39, 59, 34, 32, 11…
$ BMXHT_min                   <dbl> 78.5, 81.6, 82.8, 86.0, 82.5, 92.3, 86.9, …
$ BMXHT_max                   <dbl> 184.8, 186.4, 180.9, 187.8, 184.1, 177.4, …
$ BMXHT_mean                  <dbl> 148.9064, 150.9000, 150.5358, 156.7822, 15…
$ BMXHT_median                <dbl> 158.45, 159.00, 158.35, 161.40, 158.50, 16…
$ BMXHT_sd                    <dbl> 23.88131, 22.45114, 21.96616, 16.70671, 22…
$ BMXARMC_n                   <int> 364, 459, 522, 541, 456, 171, 544, 827, 57…
$ BMXARMC_n_miss              <int> 41, 40, 58, 44, 41, 20, 50, 65, 39, 42, 20…
$ BMXARMC_min                 <dbl> 13.8, 13.8, 13.9, 14.6, 13.7, 14.0, 13.1, …
$ BMXARMC_max                 <dbl> 54.0, 57.3, 51.7, 58.1, 48.5, 51.5, 58.3, …
$ BMXARMC_mean                <dbl> 28.14458, 29.31217, 29.28405, 30.31288, 28…
$ BMXARMC_median              <dbl> 28.00, 29.80, 30.10, 30.70, 29.30, 32.50, …
$ BMXARMC_sd                  <dbl> 8.507530, 9.030110, 8.539857, 7.509531, 8.…
$ BMXARML_n                   <int> 364, 459, 522, 541, 456, 171, 544, 827, 57…
$ BMXARML_n_miss              <int> 43, 42, 57, 45, 40, 22, 52, 66, 39, 42, 21…
$ BMXARML_min                 <dbl> 13.9, 15.0, 14.4, 16.0, 14.0, 15.6, 16.0, …
$ BMXARML_max                 <dbl> 42.0, 43.9, 43.2, 43.0, 43.9, 41.9, 43.0, …
$ BMXARML_mean                <dbl> 32.38505, 32.86547, 33.19505, 34.53145, 32…
$ BMXARML_median              <dbl> 34.60, 35.40, 35.70, 36.00, 35.15, 36.00, …
$ BMXARML_sd                  <dbl> 6.895394, 6.810559, 6.819470, 5.132052, 6.…
$ Poverty_Income_Ratio_n      <int> 364, 459, 522, 541, 456, 171, 544, 827, 57…
$ Poverty_Income_Ratio_n_miss <int> 0, 0, 0, 0, 0, 171, 0, 0, 0, 0, 0, 0, 0, 1…
$ Poverty_Income_Ratio_min    <dbl> 0.00, 0.12, 0.27, 2.25, 0.30, Inf, 0.48, 0…
$ Poverty_Income_Ratio_max    <dbl> 0.43, 0.95, 1.35, 5.00, 1.85, -Inf, 2.31, …
$ Poverty_Income_Ratio_mean   <dbl> 0.10730769, 0.46331155, 0.70402299, 4.6876…
$ Poverty_Income_Ratio_median <dbl> 0.085, 0.410, 0.680, 5.000, 0.860, NA, 1.0…
$ Poverty_Income_Ratio_sd     <dbl> 0.09773131, 0.20340318, 0.26553590, 0.5764…
$ BMXWT_n                     <int> 364, 459, 522, 541, 456, 171, 544, 827, 57…
$ BMXWT_n_miss                <int> 24, 17, 30, 27, 22, 9, 23, 36, 21, 19, 6, …
$ BMXWT_min                   <dbl> 7.7, 8.9, 8.5, 10.0, 8.9, 10.0, 8.9, 8.2, …
$ BMXWT_max                   <dbl> 157.5, 187.7, 191.6, 193.7, 219.6, 173.4, …
$ BMXWT_mean                  <dbl> 60.84735, 65.91312, 66.12337, 70.02490, 63…
$ BMXWT_median                <dbl> 59.65, 67.10, 70.05, 70.55, 64.95, 76.75, …
$ BMXWT_sd                    <dbl> 33.33993, 35.45615, 33.77805, 29.73478, 33…
$ Age_n                       <int> 364, 459, 522, 541, 456, 171, 544, 827, 57…
$ Age_n_miss                  <int> 0, 0, 0, 0, 0, 0, 0, 0, 0, 0, 0, 0, 0, 0, …
$ Age_min                     <dbl> 1, 1, 1, 1, 1, 1, 1, 1, 1, 1, 1, 1, 1, 1, …
$ Age_max                     <dbl> 80, 80, 80, 80, 80, 80, 80, 80, 80, 80, 80…
$ Age_mean                    <dbl> 24.66484, 33.91285, 35.53831, 33.82994, 31…
$ Age_median                  <dbl> 19.0, 28.0, 31.0, 35.0, 24.0, 42.0, 26.0, …
$ Age_sd                      <dbl> 20.24840, 25.68241, 26.35764, 22.24478, 25…
We can actually restructure this table if we use some dplyr:

Code
summary_table %>%
  pivot_longer(cols = contains(features_65_num$feature))
# A tibble: 18,900 × 5
# Groups:   Gender, Race, Family_Income [150]
   Gender Race  Family_Income  name          value
   <chr>  <chr> <chr>          <chr>         <dbl>
 1 Female Black $ 0 to $ 4,999 BPXDI3_n      364  
 2 Female Black $ 0 to $ 4,999 BPXDI3_n_miss 110  
 3 Female Black $ 0 to $ 4,999 BPXDI3_min      0  
 4 Female Black $ 0 to $ 4,999 BPXDI3_max    116  
 5 Female Black $ 0 to $ 4,999 BPXDI3_mean    65.1
 6 Female Black $ 0 to $ 4,999 BPXDI3_median  66  
 7 Female Black $ 0 to $ 4,999 BPXDI3_sd      16.6
 8 Female Black $ 0 to $ 4,999 BPXSY3_n      364  
 9 Female Black $ 0 to $ 4,999 BPXSY3_n_miss 110  
10 Female Black $ 0 to $ 4,999 BPXSY3_min     84  
# ℹ 18,890 more rows

We can also just focus on the counts of missing values:

Code
summary_table %>%
  pivot_longer(cols = contains(features_65_num$feature)) %>%
  filter(str_detect(name, "n_miss")) %>%
  arrange(-value)
# A tibble: 2,700 × 5
# Groups:   Gender, Race, Family_Income [150]
   Gender Race  Family_Income name          value
   <chr>  <chr> <chr>         <chr>         <dbl>
 1 Female White <NA>          BPXDI3_n_miss  2701
 2 Female White <NA>          BPXSY3_n_miss  2700
 3 Female White <NA>          BPXDI2_n_miss  2619
 4 Female White <NA>          BPXSY2_n_miss  2619
 5 Male   White <NA>          BPXDI3_n_miss  2516
 6 Male   White <NA>          BPXSY3_n_miss  2516
 7 Male   White <NA>          BPXDI2_n_miss  2488
 8 Male   White <NA>          BPXSY2_n_miss  2488
 9 Female White <NA>          BPXDI1_n_miss  2366
10 Female White <NA>          BPXSY1_n_miss  2366
# ℹ 2,690 more rows

We can impute missing values with the mean for the column, perhaps by Gender, Race, Family_Income

Code
A_DATA_2.Num.impute <- A_DATA_2.Num %>%
  filter(!is.na(DIABETES)) %>%
  mutate(
    across(
      c("Gender", "Race"), 
      \(x){if_else(is.na(x), "Missing", x)}
      )) %>%
  group_by(Gender, Race) %>%
  mutate(
    across(
      all_of(features_65_num$feature),  
      \(x){if_else(is.na(x), mean(x, na.rm = TRUE), x)}
      )
    ) %>%
  ungroup() %>%
  select(SEQN, DIABETES, Gender, Race, Family_Income, all_of(features_65_num$feature))

We can recompute our summary table - and if we were so inclined see if any of these values changed significantly:

Code
A_DATA_2.Num.impute %>%
  group_by(Gender, Race, Family_Income) %>%
  summarise(
    across(
      all_of(features_65_num$feature), # select the numeric features
      list( # list of functions to apply
        n = ~n(),
        n_miss = ~sum(is.na(.)),
        min = ~min(. , na.rm = TRUE),
        max = ~max(. , na.rm = TRUE),
        mean = ~mean(. , na.rm = TRUE),
        median = ~median(. , na.rm = TRUE),
        sd = ~sd(. , na.rm = TRUE)
        ) # end list
      ), # end across
    .groups='keep' # keep the groups is a summarise option
    ) %>% # end summarise
  ungroup() %>% # ungroup the data
  pivot_longer(contains(features_65_num$feature)) %>% # pivot the data
  filter(str_detect(name,"n_miss")) %>%
  arrange(-value)
# A tibble: 2,700 × 5
   Gender Race  Family_Income  name            value
   <chr>  <chr> <chr>          <chr>           <dbl>
 1 Female Black $ 0 to $ 4,999 BPXDI3_n_miss       0
 2 Female Black $ 0 to $ 4,999 BPXSY3_n_miss       0
 3 Female Black $ 0 to $ 4,999 BPXDI2_n_miss       0
 4 Female Black $ 0 to $ 4,999 BPXSY2_n_miss       0
 5 Female Black $ 0 to $ 4,999 BPXDI1_n_miss       0
 6 Female Black $ 0 to $ 4,999 BPXSY1_n_miss       0
 7 Female Black $ 0 to $ 4,999 BMXLEG_n_miss       0
 8 Female Black $ 0 to $ 4,999 BPXML1_n_miss       0
 9 Female Black $ 0 to $ 4,999 BPXPLS_n_miss       0
10 Female Black $ 0 to $ 4,999 PEASCTM1_n_miss     0
# ℹ 2,690 more rows

But for now let’s just look at the number of missing values:

Code
Feature_Percent_Complete_Graph(A_DATA_2.Num.impute,0)

9.5 Correlated Features

Often we will want to search for highly correlated features in order to reduce the number of them in a model.

In the extreme case, consider some variables that are perfectly correlated, i.e. linearly dependent.

Let’s say you’re using logistic regression to predict the probability of having Diabetes, where one of the predictor variables will be Age, but for some reason you read in two input variables \(x_1\) = Age in months and \(x_2\) = Age in years. Clearly, \(x_1\) and \(x_2\) are linearly dependent as \[x_1 \cdot 12 = x_2 \].

In your model, you will estimate coefficients \(\beta_i\) such that

\[\log \left( \frac{P(DIABETES == 1)}{P(DIABETES == 0)} \right)=\beta_0+\beta_1x_1+\beta_2x_2+(\cdots)\]

Due to the linear dependence, we can rewrite this:

\[\log \left( \frac{P(DIABETES == 1)}{P(DIABETES == 0)} \right)=\beta_0 + \beta_1x_1 + \beta_2\cdot ( x_1 \cdot 12) + (\cdots)\]

\[\log \left( \frac{P(DIABETES == 1)}{P(DIABETES == 0)} \right)=\beta_0 + x_1 ( \beta_1 + 12 \cdot \beta_2 ) + (\cdots)\]

SUPPOSE (for some reason) that the Age in years has no influence on Diabetic status.

Then you would expect your model to find \[\beta_1 = \beta_2=0\].

However, due to linear dependence, the model cannot distinguish between \(\beta_1=12\), \(\beta_2 = -1\) or any other combination where \(\beta_1 + 12 \cdot \beta_2 = 0\)

Thus on the one hand, your model itself might become numerically unstable. On the other hand, you can no longer interpret the results correctly.

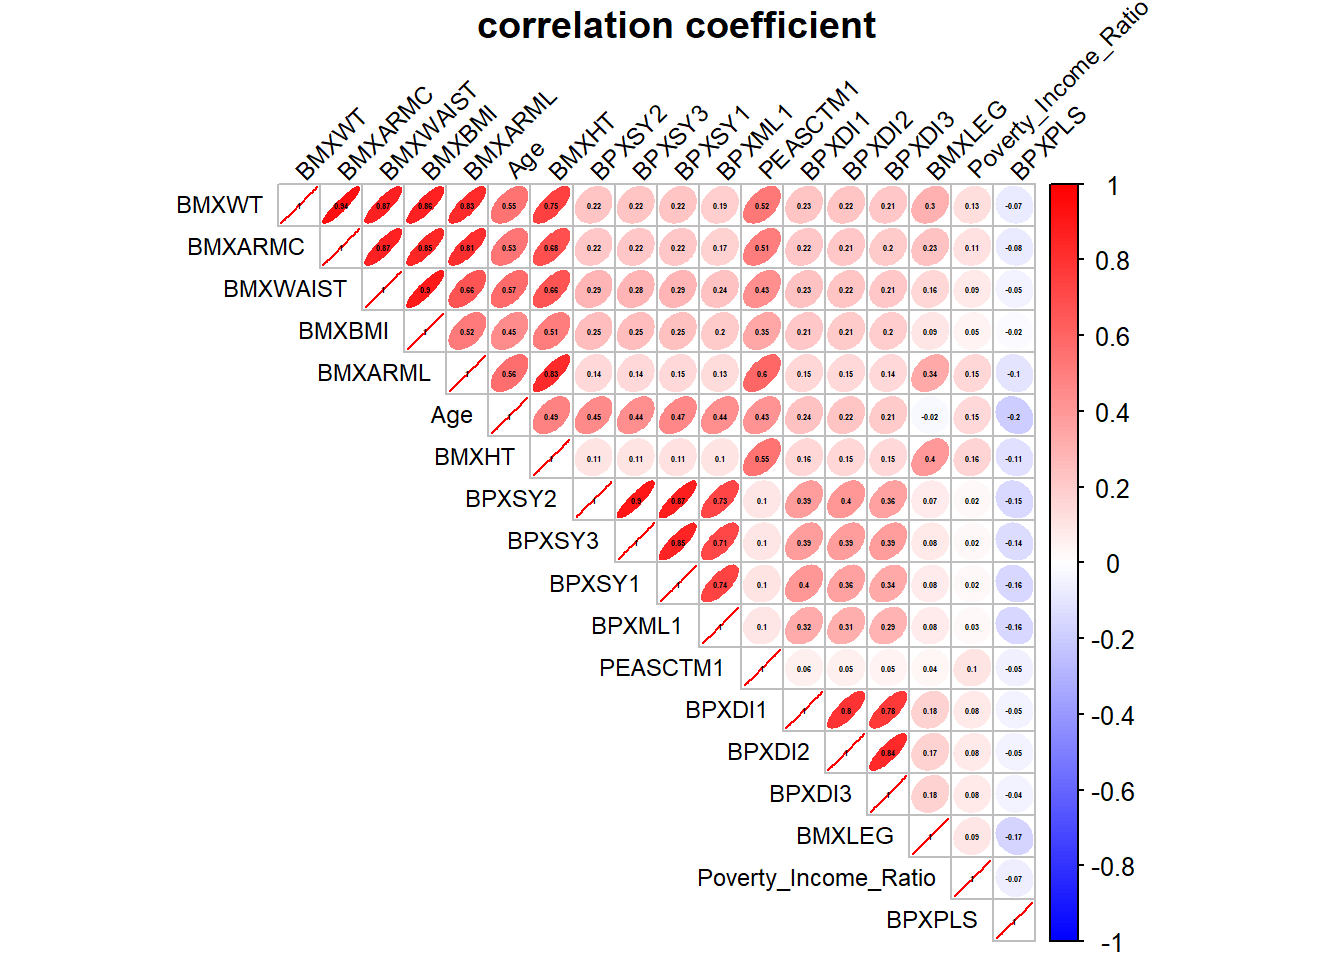
The same is true when variables are no longer linearly dependent but highly correlated.

Code
corrplot 0.92 loaded
Code
tmwr_cols <- colorRampPalette(c("blue","white", "red"))

combined_data_cor_prep <- A_DATA_2.Num.impute %>%
  select(all_of(features_65_num$feature))  

cor_res <- Hmisc::rcorr(as.matrix(combined_data_cor_prep))


combined_data_cor_prep %>%
  #rename_all(~paste0("c", seq_along(.))) %>%
  na.omit() %>%
  cor() %>% 
  corrplot::corrplot(
    col = tmwr_cols(200), 
    tl.col = "black", 
    method = "ellipse",
    order ='FPC',
    type = "upper",
    title = "Correlated Features Plot \n correlation coefficient",
    addCoef.col = "black",
    number.cex = 0.25,
    tl.cex = 0.75,           # Size of the feature labels
    tl.srt = 45)

Code
library('corrr')
cor.corr_data <- correlate(A_DATA_2.Num.impute %>% select(all_of(features_65_num$feature)))
Correlation computed with
• Method: 'pearson'
• Missing treated using: 'pairwise.complete.obs'
Code
cor.corr_data %>%
  glimpse()
Rows: 18
Columns: 19
$ term                 <chr> "BPXDI3", "BPXSY3", "BPXDI2", "BPXSY2", "BPXDI1",…
$ BPXDI3               <dbl> NA, 0.38920867, 0.83967525, 0.36443328, 0.7753937…
$ BPXSY3               <dbl> 0.38920867, NA, 0.38726807, 0.90335402, 0.3855849…
$ BPXDI2               <dbl> 0.83967525, 0.38726807, NA, 0.40498199, 0.7965398…
$ BPXSY2               <dbl> 0.36443328, 0.90335402, 0.40498199, NA, 0.3885915…
$ BPXDI1               <dbl> 0.77539372, 0.38558496, 0.79653986, 0.38859151, N…
$ BPXSY1               <dbl> 0.33796063, 0.85488694, 0.36272962, 0.87340339, 0…
$ BMXLEG               <dbl> 0.17755182, 0.08128816, 0.17371484, 0.07458496, 0…
$ BPXML1               <dbl> 0.29189725, 0.71441600, 0.31253493, 0.72838772, 0…
$ BPXPLS               <dbl> -0.04218378, -0.13904054, -0.04813751, -0.1459656…
$ PEASCTM1             <dbl> 0.04786246, 0.09740853, 0.05094561, 0.09772117, 0…
$ BMXWAIST             <dbl> 0.21484511, 0.28490823, 0.22377722, 0.28689614, 0…
$ BMXBMI               <dbl> 0.19847274, 0.25144750, 0.20672813, 0.25229207, 0…
$ BMXHT                <dbl> 0.1497063, 0.1099074, 0.1519246, 0.1080122, 0.157…
$ BMXARMC              <dbl> 0.20485012, 0.21875540, 0.21110377, 0.21854444, 0…
$ BMXARML              <dbl> 0.1432836, 0.1448157, 0.1464210, 0.1440410, 0.152…
$ Poverty_Income_Ratio <dbl> 0.08229314, 0.02244386, 0.08448418, 0.02402425, 0…
$ BMXWT                <dbl> 0.21497276, 0.22357424, 0.22145776, 0.22239343, 0…
$ Age                  <dbl> 0.20551574, 0.43888769, 0.22400775, 0.45189382, 0…

Let’s find all the rows where Age has a correlation of .5 or more with another variable.

Code
cor.corr_data %>%
   filter(Age > .5)
# A tibble: 4 × 19
  term  BPXDI3 BPXSY3 BPXDI2 BPXSY2 BPXDI1 BPXSY1 BMXLEG BPXML1  BPXPLS PEASCTM1
  <chr>  <dbl>  <dbl>  <dbl>  <dbl>  <dbl>  <dbl>  <dbl>  <dbl>   <dbl>    <dbl>
1 BMXW…  0.215  0.285  0.224  0.287  0.233  0.287  0.157  0.238 -0.0462    0.432
2 BMXA…  0.205  0.219  0.211  0.219  0.219  0.217  0.231  0.173 -0.0769    0.510
3 BMXA…  0.143  0.145  0.146  0.144  0.153  0.148  0.339  0.131 -0.104     0.599
4 BMXWT  0.215  0.224  0.221  0.222  0.229  0.220  0.301  0.187 -0.0701    0.521
# ℹ 8 more variables: BMXWAIST <dbl>, BMXBMI <dbl>, BMXHT <dbl>, BMXARMC <dbl>,
#   BMXARML <dbl>, Poverty_Income_Ratio <dbl>, BMXWT <dbl>, Age <dbl>

Let’s find all the rows where any feature has a correlation of .7 or more with another variable:

Code
cor.corr_data %>%
   filter_at(vars(all_of(features_65_num$feature)), any_vars( . > .7 ))
# A tibble: 13 × 19
   term     BPXDI3 BPXSY3 BPXDI2 BPXSY2 BPXDI1 BPXSY1 BMXLEG BPXML1  BPXPLS
   <chr>     <dbl>  <dbl>  <dbl>  <dbl>  <dbl>  <dbl>  <dbl>  <dbl>   <dbl>
 1 BPXDI3   NA      0.389  0.840  0.364  0.775  0.338 0.178   0.292 -0.0422
 2 BPXSY3    0.389 NA      0.387  0.903  0.386  0.855 0.0813  0.714 -0.139 
 3 BPXDI2    0.840  0.387 NA      0.405  0.797  0.363 0.174   0.313 -0.0481
 4 BPXSY2    0.364  0.903  0.405 NA      0.389  0.873 0.0746  0.728 -0.146 
 5 BPXDI1    0.775  0.386  0.797  0.389 NA      0.404 0.178   0.320 -0.0498
 6 BPXSY1    0.338  0.855  0.363  0.873  0.404 NA     0.0773  0.739 -0.156 
 7 BPXML1    0.292  0.714  0.313  0.728  0.320  0.739 0.0799 NA     -0.157 
 8 BMXWAIST  0.215  0.285  0.224  0.287  0.233  0.287 0.157   0.238 -0.0462
 9 BMXBMI    0.198  0.251  0.207  0.252  0.213  0.247 0.0948  0.202 -0.0185
10 BMXHT     0.150  0.110  0.152  0.108  0.157  0.112 0.397   0.105 -0.114 
11 BMXARMC   0.205  0.219  0.211  0.219  0.219  0.217 0.231   0.173 -0.0769
12 BMXARML   0.143  0.145  0.146  0.144  0.153  0.148 0.339   0.131 -0.104 
13 BMXWT     0.215  0.224  0.221  0.222  0.229  0.220 0.301   0.187 -0.0701
# ℹ 9 more variables: PEASCTM1 <dbl>, BMXWAIST <dbl>, BMXBMI <dbl>,
#   BMXHT <dbl>, BMXARMC <dbl>, BMXARML <dbl>, Poverty_Income_Ratio <dbl>,
#   BMXWT <dbl>, Age <dbl>

Above we used an _at version of a dplyr function, in this case it will apply the function any_vars( . > .7 ) to the columns corr_features.

Code
cor.corr_data %>% 
  focus(BMXWT, BMXARMC, BMXARML, BMXWAIST)
# A tibble: 14 × 5
   term                   BMXWT BMXARMC BMXARML BMXWAIST
   <chr>                  <dbl>   <dbl>   <dbl>    <dbl>
 1 BPXDI3                0.215   0.205    0.143   0.215 
 2 BPXSY3                0.224   0.219    0.145   0.285 
 3 BPXDI2                0.221   0.211    0.146   0.224 
 4 BPXSY2                0.222   0.219    0.144   0.287 
 5 BPXDI1                0.229   0.219    0.153   0.233 
 6 BPXSY1                0.220   0.217    0.148   0.287 
 7 BMXLEG                0.301   0.231    0.339   0.157 
 8 BPXML1                0.187   0.173    0.131   0.238 
 9 BPXPLS               -0.0701 -0.0769  -0.104  -0.0462
10 PEASCTM1              0.521   0.510    0.599   0.432 
11 BMXBMI                0.861   0.846    0.516   0.895 
12 BMXHT                 0.747   0.681    0.830   0.665 
13 Poverty_Income_Ratio  0.128   0.111    0.151   0.0895
14 Age                   0.550   0.533    0.563   0.575 
Code
cor.corr_data %>%
  focus(BMXWT, BMXARMC, BMXARML, BMXWAIST, mirror = TRUE) %>%  # Focus only on these
  shave() %>% # Remove the upper triangle
  fashion()   # Print in nice format
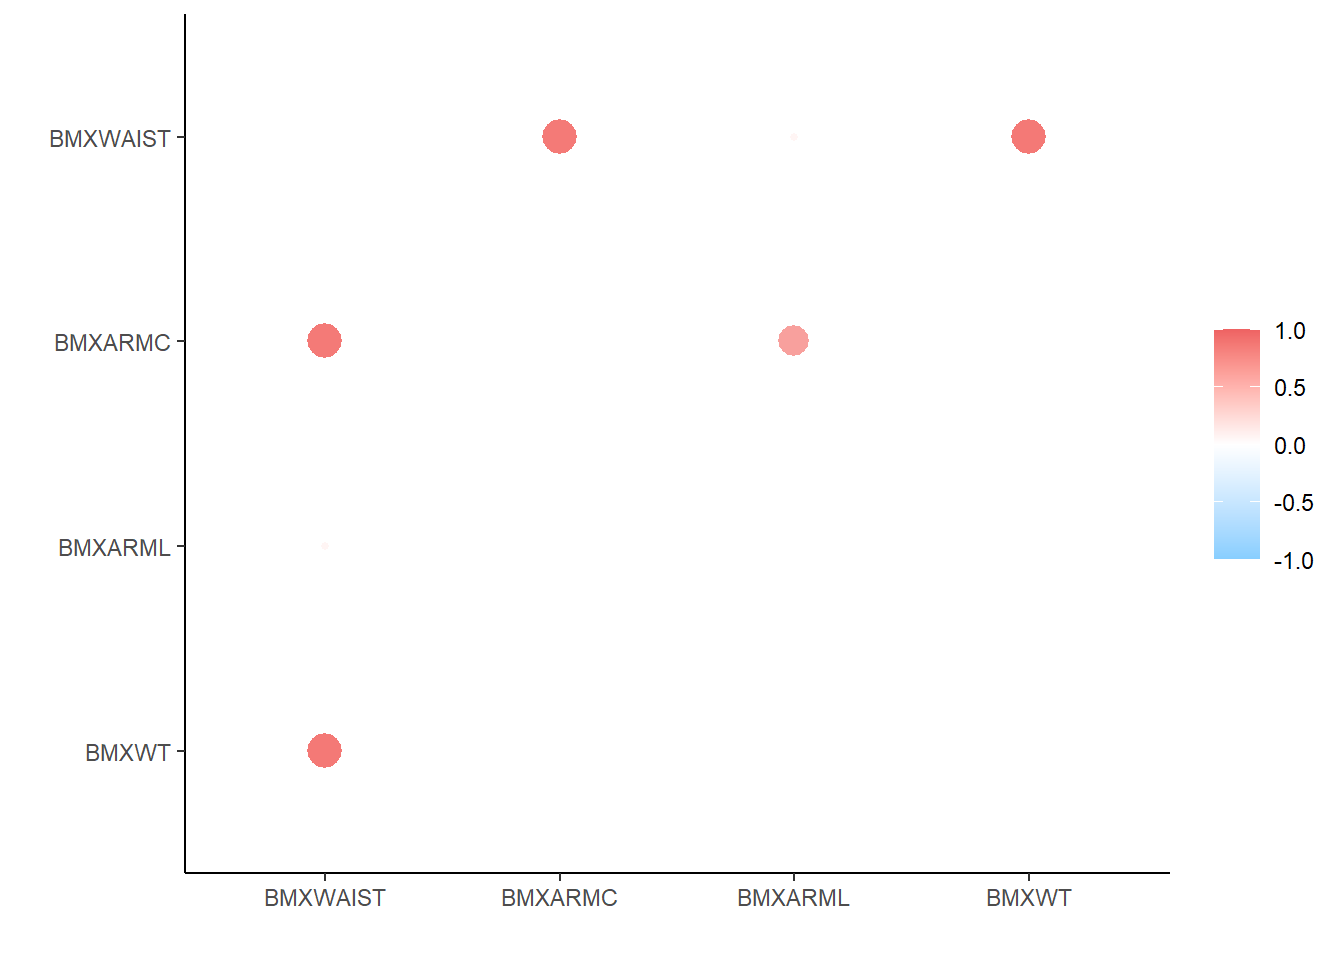
      term BMXWT BMXARMC BMXARML BMXWAIST
1 BMXWAIST   .87                         
2  BMXARMC   .94                         
3  BMXARML   .83     .81                 
4    BMXWT           .94     .83      .87
Code
cor.corr_data %>%
  focus(BMXWT, BMXARMC, BMXARML, BMXWAIST, mirror = TRUE) %>%
  shave(upper = FALSE) %>% 
  rplot(colours = c("skyblue1", "white",  "indianred2"))     

The findCorrelation function in the caret library is useful to find correlated features as well:

Code
correlated_features <- caret::findCorrelation( cor(A_DATA_2.Num.impute %>% select(all_of(features_65_num$feature)) ),
                        cutoff = .8,
                        names = TRUE )

correlated_features
[1] "BMXWT"    "BMXARMC"  "BMXWAIST" "BMXARML"  "BPXSY2"   "BPXSY3"   "BPXDI2"  

9.6 Principal Component Analysis

Principal Component Analysis describes an orthogonal (preserves inner product) linear transformation of the data; where the data are mapped into a new coordinate system for which the first dimension (the first principal component) contains the greatest variance of the data; the second dimension contains the second greatest variance; and so on.

We will showcase how Principal Component Analysis (PCA) can yield the Principal Components (PCs) can be utilized as effectively as features in a predictive model.

First will split the data:

Code
set.seed(4321)

A_DATA_2.Num.impute <- A_DATA_2.Num.impute %>%
  mutate(DIABETES_factor = as.factor(DIABETES))


PCA_train.sample <- sample(A_DATA_2.Num.impute$SEQN,
                    nrow(A_DATA_2.Num.impute)*.65,
                    replace = FALSE)

PCA.train <- A_DATA_2.Num.impute %>%
  filter(SEQN %in% PCA_train.sample) 

PCA.test <- A_DATA_2.Num.impute %>%
  filter(!(SEQN %in% PCA_train.sample)) 

9.6.1 Fit PCA Model

Below, we set center and scale to TRUE so R will center (subtract the mean) and scale (divide by the standard deviation) by each numeric column (i.e., z-score, normalize. or standardize the data). Now we can fit a PCA model on the training data:

Code
A_DATA_2.pca.model <- prcomp(PCA.train %>% select(all_of(features_65_num$feature)), 
                              center=TRUE,
                              scale=TRUE)

A_DATA_2.pca.sum <- summary(A_DATA_2.pca.model)
A_DATA_2.pca.sum
Importance of components:
                          PC1    PC2    PC3     PC4     PC5     PC6     PC7
Standard deviation     2.5949 1.8632 1.3535 1.11351 0.99700 0.92733 0.90471
Proportion of Variance 0.3741 0.1929 0.1018 0.06888 0.05522 0.04777 0.04547
Cumulative Proportion  0.3741 0.5669 0.6687 0.73760 0.79282 0.84060 0.88607
                           PC8     PC9    PC10    PC11    PC12    PC13    PC14
Standard deviation     0.67546 0.54761 0.50835 0.49355 0.48052 0.40548 0.36967
Proportion of Variance 0.02535 0.01666 0.01436 0.01353 0.01283 0.00913 0.00759
Cumulative Proportion  0.91142 0.92808 0.94243 0.95597 0.96880 0.97793 0.98552
                          PC15    PC16    PC17    PC18
Standard deviation     0.30145 0.29972 0.22785 0.16732
Proportion of Variance 0.00505 0.00499 0.00288 0.00156
Cumulative Proportion  0.99057 0.99556 0.99844 1.00000

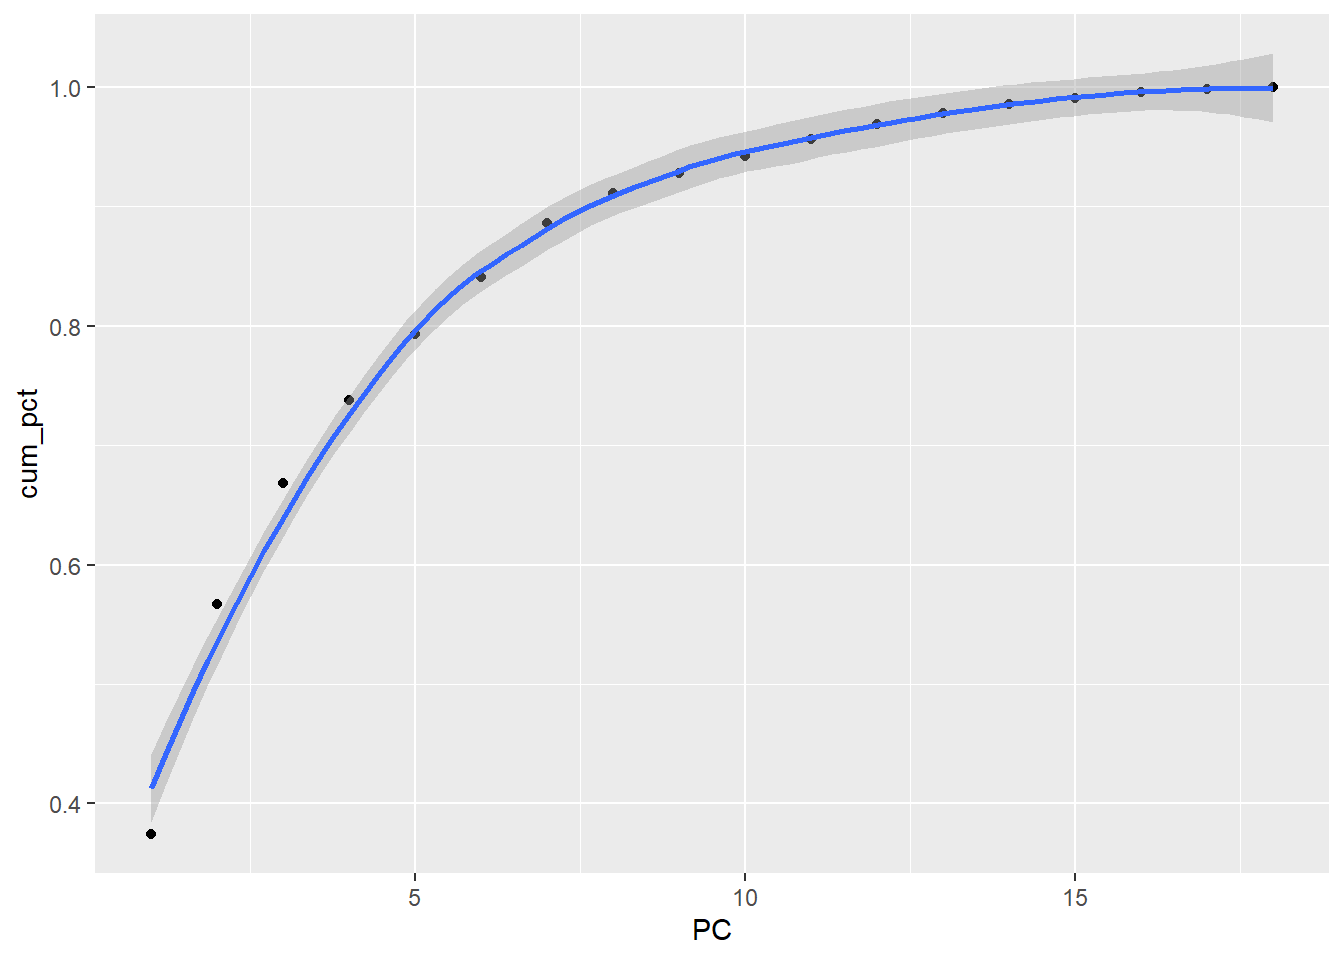
You can see there are 18 principal components, with each explaining a proportion of the variability in the data. For example, PC1 explains 37.407% of the total variance; the first 5 principal components account for over 79.282% of the variance; the first 10 principal components account for over 94.243% of the variance.

9.6.2 Plot Principal Components

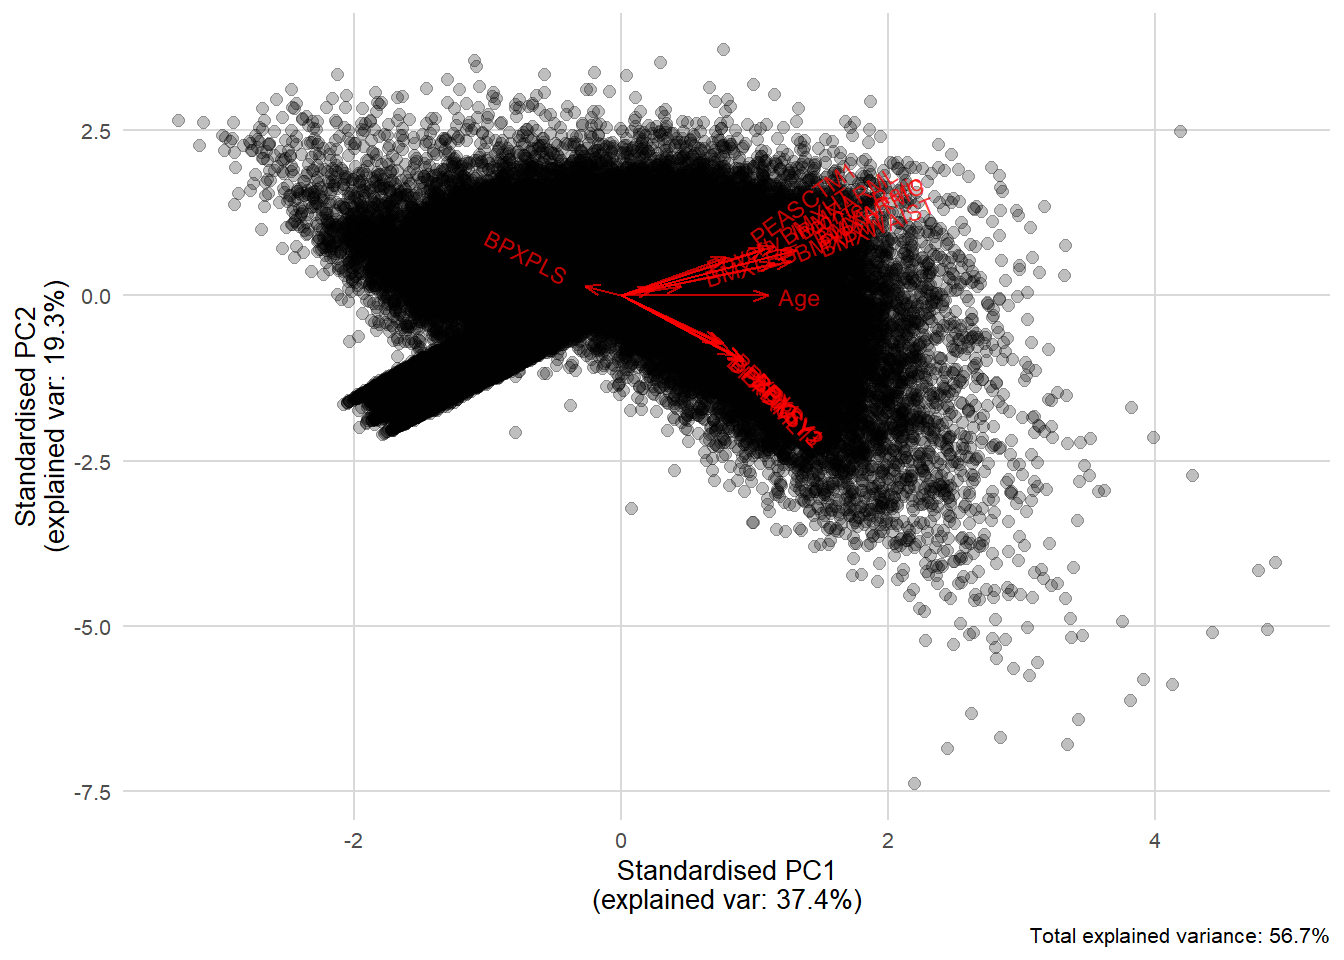
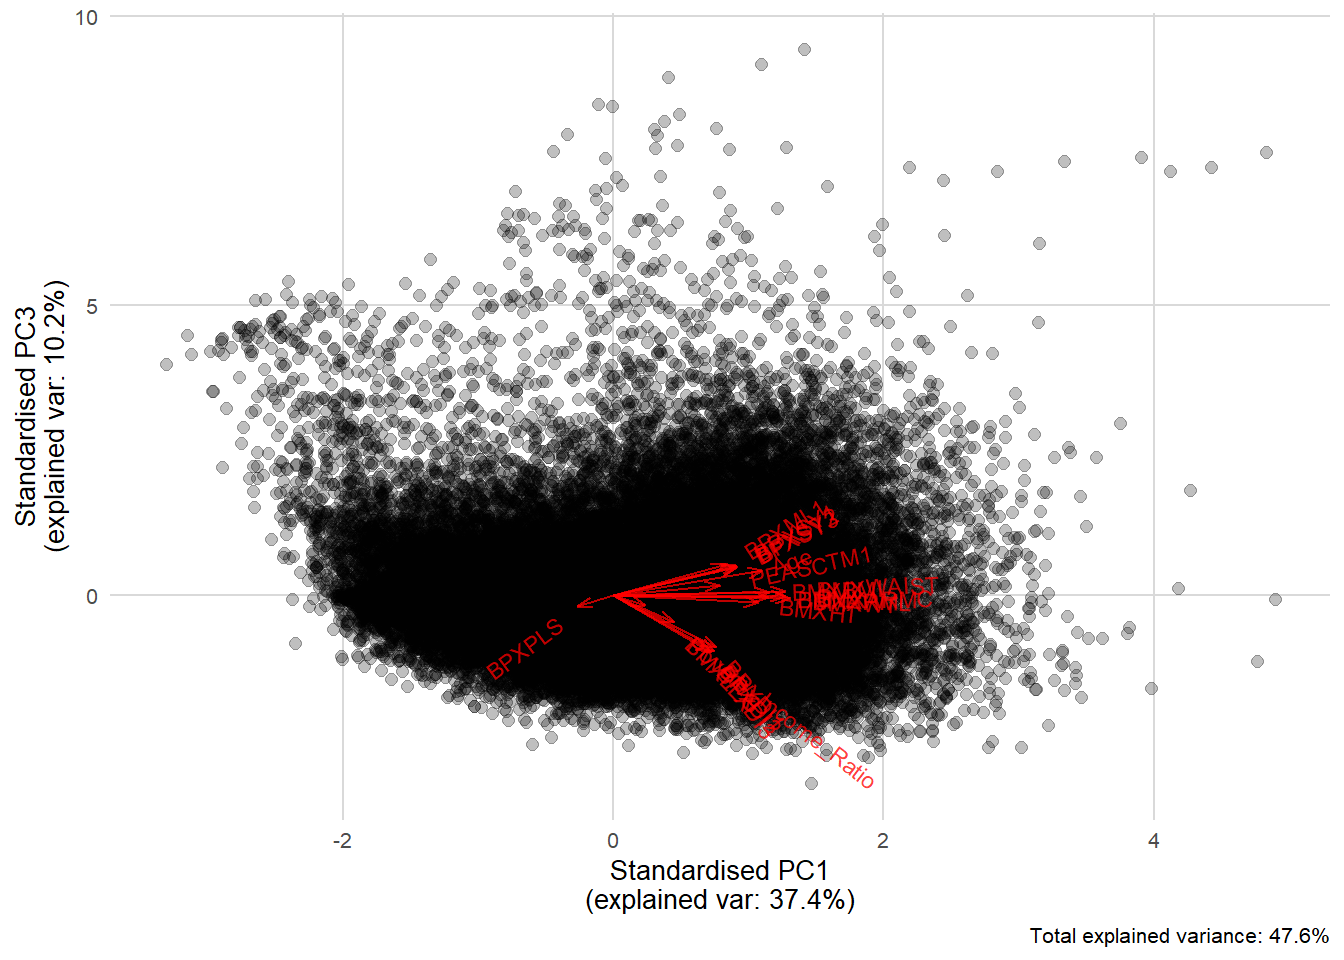
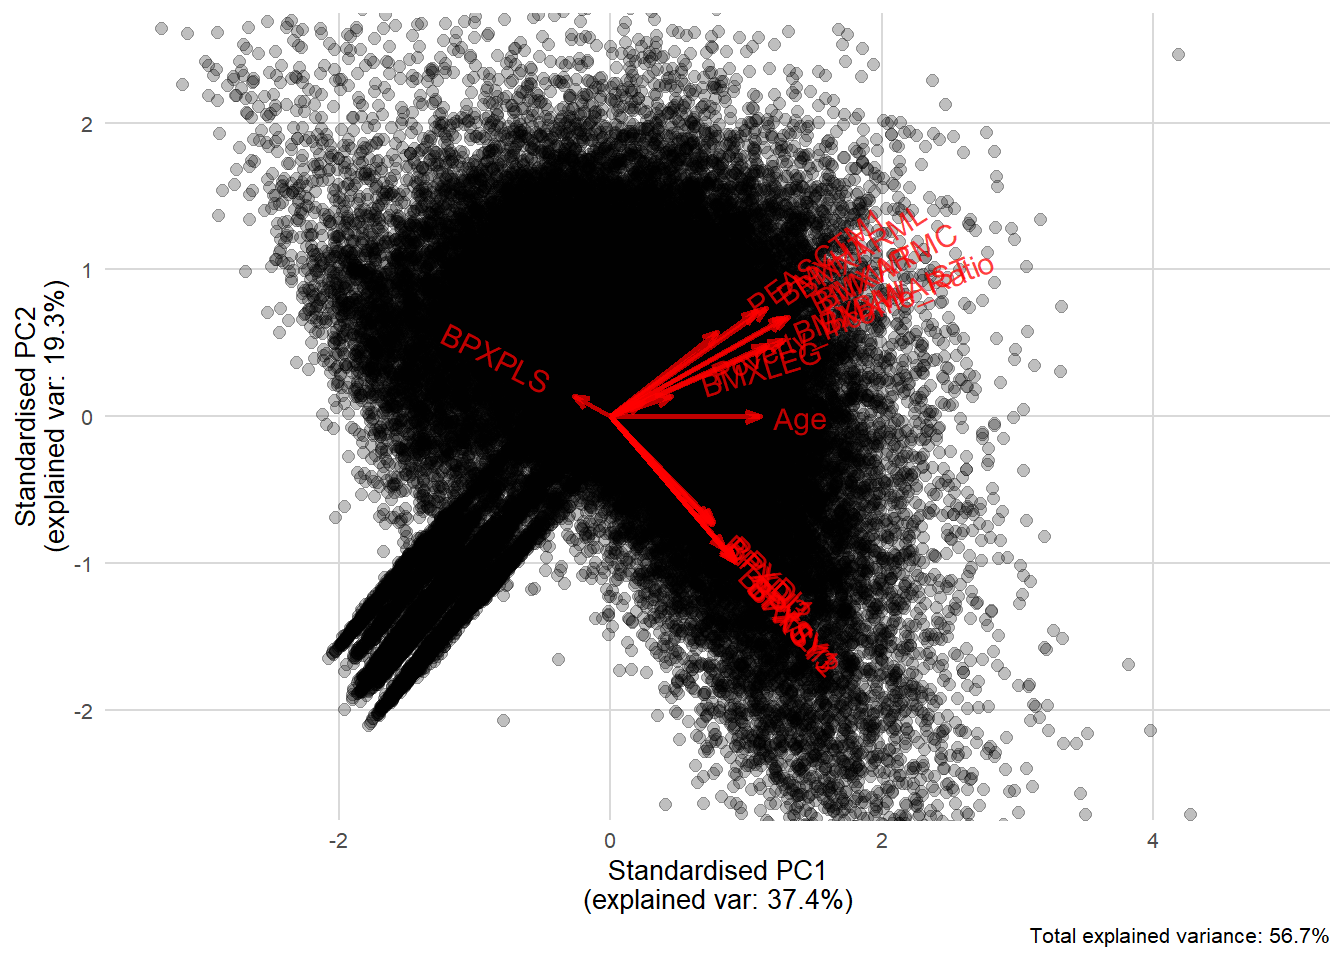
The biplot is used to visualize principal components. This plots the first and second principal components. The closer the variable is the the center, the less contribution that variable has to either principal component. The configuration of arrows reflects the relations of the variables. The cosine of the angle (the dot product) between the arrows reflects the correlation between the variables they represent, and the principal component.

Code
AMR::ggplot_pca(A_DATA_2.pca.model, arrows_colour = 'red') # note here that the assumption is to plot PC1 V PC2

biplot PC1 Vs PC2

This is the first versus the third principal component, again notice the magnitude and direction of the vector with relation to the first principal component:

Code
AMR::ggplot_pca(A_DATA_2.pca.model,
                choices = c(1,3), # here we specify PC1 V PC3 
                arrows_colour = 'red')

biplot PC1 Vs PC3

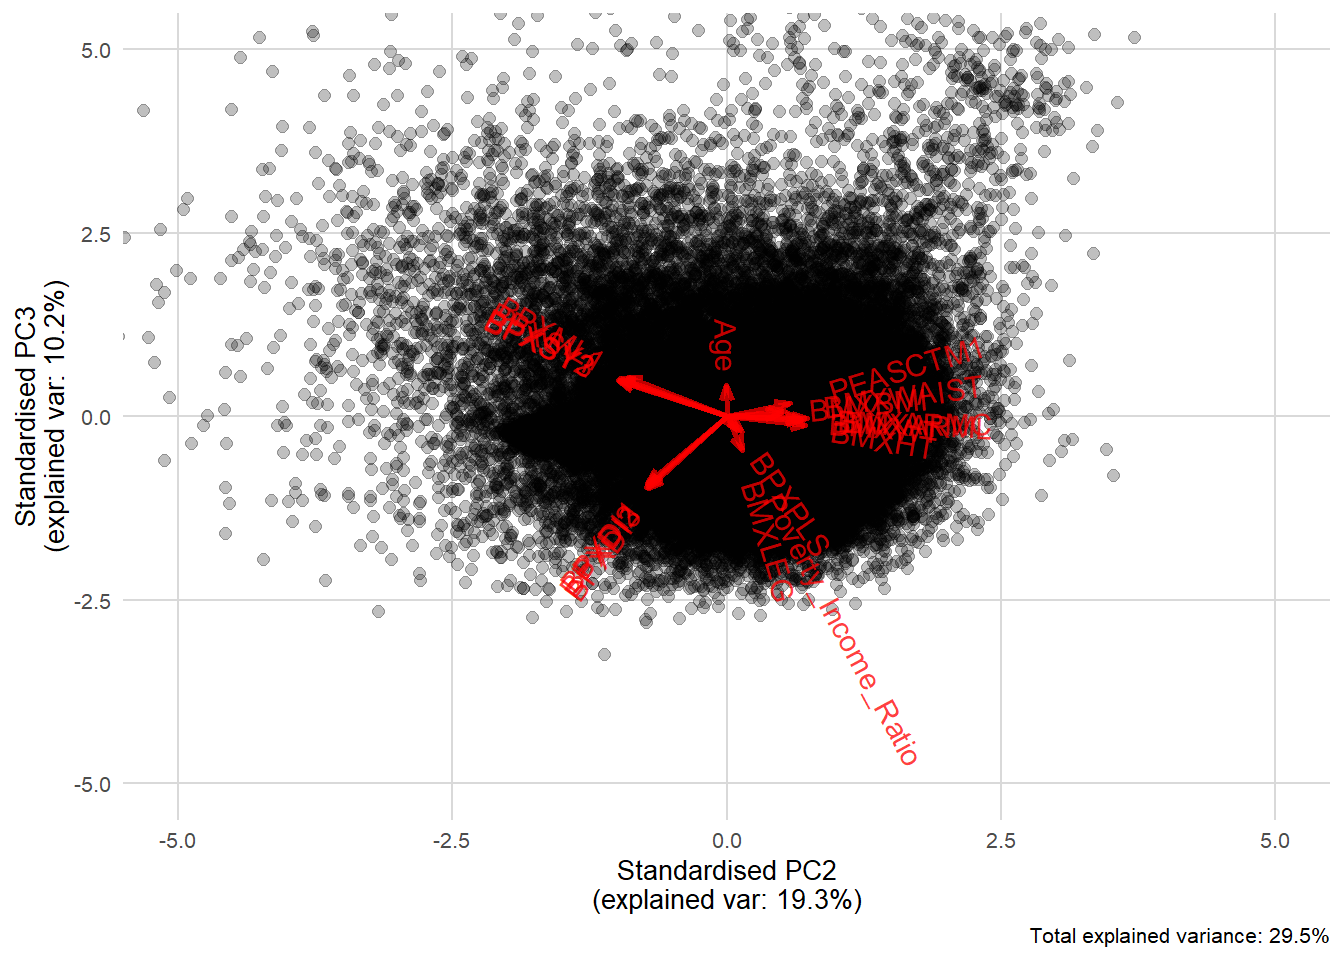
And now here’s a look at the second versus the third, we see everything is concentrated near the origin (Remark when we zoomed in with coord_cartesian some points were excluded from the Figure below)

Code
AMR::ggplot_pca(A_DATA_2.pca.model,
                choices = c(2,3),
                arrows_colour = 'red',
                arrows_size = 1,
                arrows_textsize = 4) +
  coord_cartesian(xlim = c(-5,5), ylim=c(-5,5))

biplot PC2 Vs PC3

9.6.3 Scree Plot

We aim to find the components with the maximum variance so we can retain as much information about the original dataset as possible.

To determine the number of principal components to retain in our analysis we need to compute the proportion of variance explained.

We can plot the cumulative proportion of variance explained in a scree plot to determine the number of principal components to retain:

Code
var_exp <- A_DATA_2.pca.model$sdev^2

# Proportion of variance explained
pct_var_exp <- var_exp/sum(var_exp)

Prop_Var_Explained_df <- as_tibble(cbind(var_exp, pct_var_exp))

Prop_Var_Explained_df$PC <- 1:nrow(Prop_Var_Explained_df)


Prop_Var_Explained_df <- Prop_Var_Explained_df %>%
  mutate(cum_pct = cumsum(pct_var_exp)) 

Prop_Var_Explained_df %>%
  ggplot(aes(x=PC, y=cum_pct)) +
  geom_point() +
  geom_smooth()
`geom_smooth()` using method = 'loess' and formula = 'y ~ x'

Code
min_cum_pct <- min(Prop_Var_Explained_df$cum_pct)

min_cum_pct
[1] 0.3740717
Code
pc_var2 <- Prop_Var_Explained_df %>%
  filter(cum_pct <= max(0.8, min_cum_pct))

pc_var2 %>%
  head()
# A tibble: 5 × 4
  var_exp pct_var_exp    PC cum_pct
    <dbl>       <dbl> <int>   <dbl>
1   6.73       0.374      1   0.374
2   3.47       0.193      2   0.567
3   1.83       0.102      3   0.669
4   1.24       0.0689     4   0.738
5   0.994      0.0552     5   0.793
Code
ggplot(pc_var2, aes(x = reorder(PC, pct_var_exp), y = pct_var_exp)) +
    geom_bar(stat = "identity") +
    scale_y_continuous(labels = scales::percent) +
    coord_flip() +
    labs(x = "Principal Components", y = "% Variance Explained")

Next let’s get the eigenvectors

Code
rotation_tibble <- as_tibble(A_DATA_2.pca.model$rotation , rownames='Feature')

rotation_tibble %>%
  head()
# A tibble: 6 × 19
  Feature   PC1    PC2    PC3      PC4     PC5     PC6     PC7      PC8     PC9
  <chr>   <dbl>  <dbl>  <dbl>    <dbl>   <dbl>   <dbl>   <dbl>    <dbl>   <dbl>
1 BPXDI3  0.182 -0.251 -0.475  0.0705  -0.0588  0.119  -0.0176  0.0113   0.0643
2 BPXSY3  0.230 -0.345  0.232 -0.00584  0.0517 -0.120  -0.0510  0.117    0.358 
3 BPXDI2  0.189 -0.258 -0.465  0.0716  -0.0632  0.122  -0.0125 -0.00103  0.0182
4 BPXSY2  0.231 -0.349  0.241 -0.00866  0.0462 -0.113  -0.0455  0.0994   0.307 
5 BPXDI1  0.191 -0.253 -0.438  0.0683  -0.0560  0.108  -0.0135 -0.0224  -0.115 
6 BPXSY1  0.229 -0.340  0.253 -0.0216   0.0424 -0.0987 -0.0478  0.0526   0.116 
# ℹ 9 more variables: PC10 <dbl>, PC11 <dbl>, PC12 <dbl>, PC13 <dbl>,
#   PC14 <dbl>, PC15 <dbl>, PC16 <dbl>, PC17 <dbl>, PC18 <dbl>

Get the values per the feature

Code
rotation_tibble_T <- rotation_tibble %>%
  pivot_longer(-Feature, names_to = 'variable', values_to = 'value') 

rotation_tibble_T %>%
  head()
# A tibble: 6 × 3
  Feature variable   value
  <chr>   <chr>      <dbl>
1 BPXDI3  PC1       0.182 
2 BPXDI3  PC2      -0.251 
3 BPXDI3  PC3      -0.475 
4 BPXDI3  PC4       0.0705
5 BPXDI3  PC5      -0.0588
6 BPXDI3  PC6       0.119 

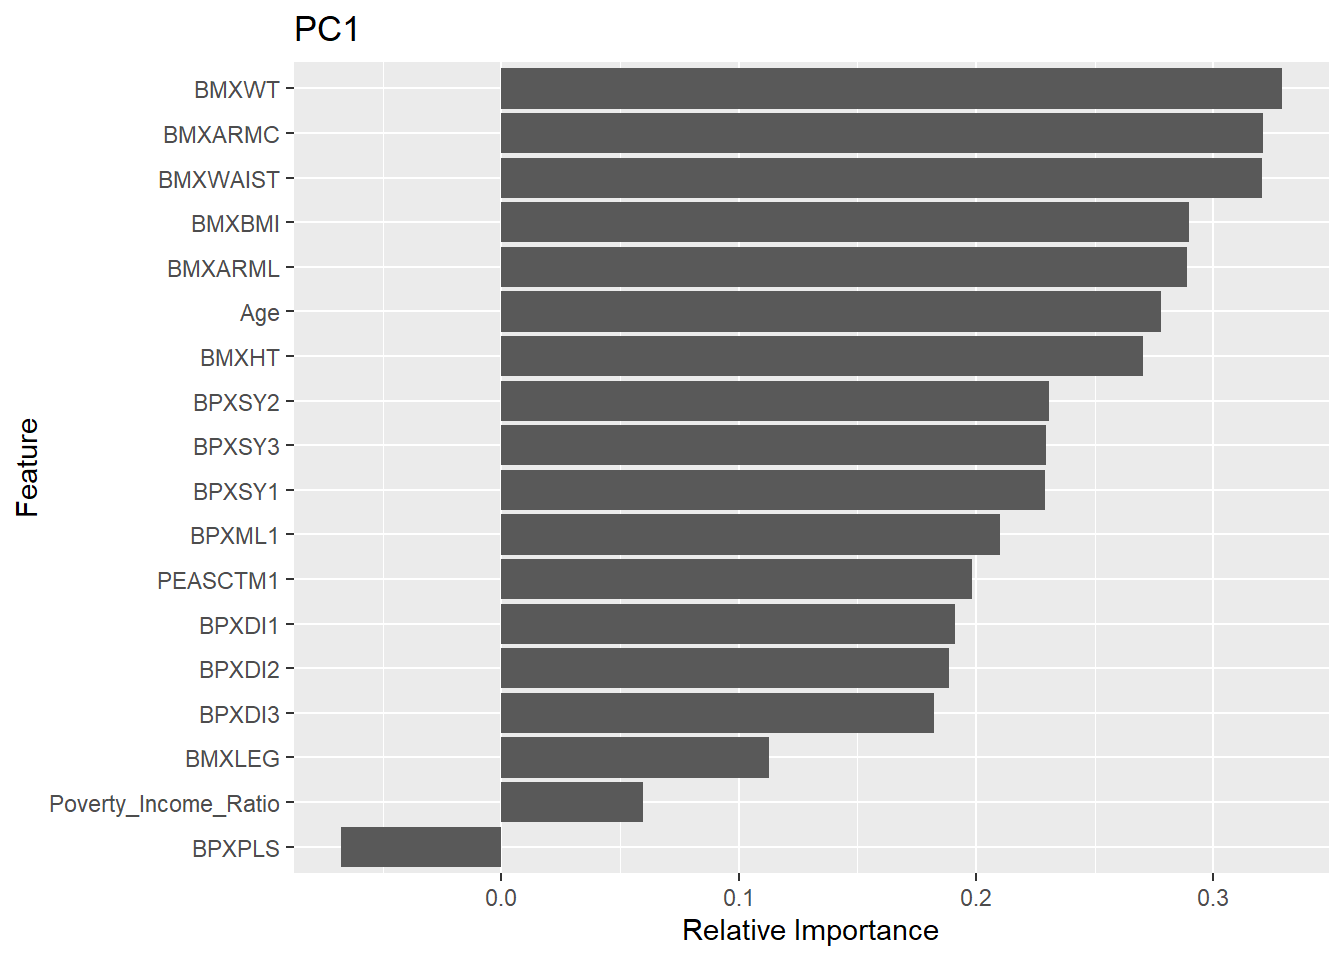
Plot the results of the feature’s contribution to the PC - lets do the 1st below:

Code
rotation_tibble_T %>%
  filter(variable == paste0("PC", 1)) %>%
  ggplot(aes(x = Feature, y = value)) +
  geom_bar(stat = "identity") +
  coord_flip() +
  ylab("Relative Importance")

9.6.3.1 proc.pca

We can functionalize the entire above process and enhance the proportion of variance explained graph with a ggplot:

Code
proc.pca <- function(data ){
  
  # fit PCA model 
  data.pca <- prcomp(data, 
                      center=TRUE,
                      scale=TRUE)


 biplot_function <- function(choices = c(1,2) , # these are the things I probably want to pass into biplot
                              arrows_colour = "red",
                              arrows_size = 1,
                              arrows_textsize = 4, # the ... should pass anything else 
                              ...){
    AMR::ggplot_pca(data.pca,
                    choices = choices,
                    arrows = TRUE,
                    arrows_colour = arrows_colour, # I think Red is easier to see on Black
                    arrows_size = arrows_size, # bigger arrows
                    arrows_textsize = 4, #bigger text size 
                    ...)
   }

 
  # Proportion of variance explained
  var_exp <- data.pca$sdev^2
  
  pct_var_exp <- var_exp/sum(var_exp)

  Prop_Var_Explained_df <- as_tibble(cbind(var_exp ,pct_var_exp))

  Prop_Var_Explained_df$PC <- 1:nrow(Prop_Var_Explained_df)

  Prop_Var_Explained_df <- Prop_Var_Explained_df %>%
    mutate(cum_pct = cumsum(pct_var_exp)) %>%
    select(PC, var_exp, pct_var_exp, cum_pct)

  # scree plot 
  scree_plot <- Prop_Var_Explained_df %>%
    ggplot(aes(x=PC, y=cum_pct)) +
    geom_point() +
    geom_smooth()

  # PC_var_Explained_bar
  min_cum_pct <- min(Prop_Var_Explained_df$cum_pct)

  PC_var_Explained_bar <- function(variance_cap = 0.8){
  
    pc_var2 <- Prop_Var_Explained_df %>%
      filter(cum_pct <= max(variance_cap, min_cum_pct))

    PC_var_Explained_bar <- ggplot(pc_var2, aes(x = reorder(PC, pct_var_exp), y = pct_var_exp)) +
      geom_bar(stat = "identity") +
      scale_y_continuous(labels = scales::percent) +
      coord_flip() +
      labs(x = "Principal Components", y = "% Variance Explained")

    return(PC_var_Explained_bar)
    }

  #Feature_Imp_PC
   
   # eigenvectors
  rotation_tibble <- as_tibble(A_DATA_2.pca.model$rotation , rownames='Feature')
    
   # get the values per the feature  
  rotation_tibble_T <- rotation_tibble %>%
    pivot_longer(-Feature, names_to = 'variable', values_to = 'value')

    # here's a nice plot of the feature's contribution to the PC 
  Feature_Imp_PC <- function(PC_Num = 1){
    rotation_tibble_T %>%
      filter(variable == paste0("PC", PC_Num)) %>%
      mutate(Feature = reorder(Feature, value)) %>%
      ggplot(aes(x = Feature, y = value)) +
      geom_bar(stat = "identity") +
      coord_flip() +
      ylab("Relative Importance") +
      labs(title = paste0("PC",PC_Num))
    }

#QED

return(list(PCA_Sum = summary(data.pca) ,
            Prop_Var_Explained_df = Prop_Var_Explained_df,
            scree_plot = scree_plot,
            biplot = biplot_function, 
            PC_var_Explained_bar = PC_var_Explained_bar,
            Feature_Imp_PC = Feature_Imp_PC)
       ) 
}
9.6.3.1.1 test proc.pca

Now we can test our function:

Code
OUTPUT.proc.pca <- proc.pca(PCA.train %>% select(all_of(features_65_num$feature)))

Let’s check out the Relative Feature Importance in PC8, for instance:

Code
OUTPUT.proc.pca$Feature_Imp_PC(8)

Again note how most of the variance is explained by the PC1:

Code
OUTPUT.proc.pca$PC_var_Explained_bar(1)

Also note the high Feature Relative Importance of features like BMXWT , Age and BMXBMI in this graph in Figure below:

Code
OUTPUT.proc.pca$Feature_Imp_PC(1)

Feature Relative Importance - PC1

and the corresponding magnitude and direction of the vector in the plot in Figure below:

Code
OUTPUT.proc.pca$biplot(c(1,2))  +
  coord_cartesian(ylim=c(-2.5,2.5))

biplot PC1 V PC2

At the same time, note the above magnitude and direction of BPXPLS corresponding to the negative feature relative importance in PC2 in Figure below:

Code
OUTPUT.proc.pca$Feature_Imp_PC(2)

Getting back on track, we recall

Code
OUTPUT.proc.pca$Prop_Var_Explained_df %>%
  filter(3 <= PC & PC <= 7 ) %>%
  kbl() %>%
  kable_paper("striped", full_width = F) %>%
  row_spec(3, bold = T, color = "white", background = "#D7261E")
PC var_exp pct_var_exp cum_pct
3 1.8319212 0.1017734 0.6687171
4 1.2399124 0.0688840 0.7376011
5 0.9940102 0.0552228 0.7928239
6 0.8599465 0.0477748 0.8405987
7 0.8185082 0.0454727 0.8860714

So knowing 5 Principal Components accounts for about 84.3% of the variance of the data observed in the PCA.train dataset.

9.6.4 Modeling with PCs

We will quickly compare models using:

  • all of the numeric features
  • the first 5 PCs
  • 5 random features

First, we’ll use the predict to predict the PCAs onto PCA.train, we then attach those predictions to PCA.train with the cbind:

Code
PCA.PCA.train <- cbind(PCA.train, predict(A_DATA_2.pca.model, PCA.train))

PCA.PCA.train %>%
  glimpse()
Rows: 62,105
Columns: 42
$ SEQN                 <dbl> 36818, 9031, 53291, 60723, 34933, 26505, 55789, 1…
$ DIABETES             <dbl> 0, 1, 0, 0, 0, 0, 1, 0, 0, 1, 0, 0, 0, 0, 0, 0, 0…
$ Gender               <chr> "Female", "Male", "Female", "Female", "Male", "Fe…
$ Race                 <chr> "Other Hispanic", "Black", "White", "Black", "Mex…
$ Family_Income        <chr> NA, NA, "$20,000 to $24,999", "$ 0 to $ 4,999", N…
$ BPXDI3               <dbl> 64.00000, 66.99878, 60.00000, 66.11492, 64.00000,…
$ BPXSY3               <dbl> 104.0000, 121.7824, 106.0000, 118.8599, 106.0000,…
$ BPXDI2               <dbl> 62.00000, 67.00160, 68.00000, 66.05193, 66.00000,…
$ BPXSY2               <dbl> 110.0000, 122.1358, 110.0000, 119.4753, 104.0000,…
$ BPXDI1               <dbl> 70.00000, 67.28744, 64.00000, 65.88837, 56.00000,…
$ BPXSY1               <dbl> 114.0000, 122.5225, 106.0000, 119.5301, 100.0000,…
$ BMXLEG               <dbl> 35.50000, 44.40000, 37.60000, 38.95650, 42.10000,…
$ BPXML1               <dbl> 150.0000, 149.4231, 140.0000, 146.0224, 130.0000,…
$ BPXPLS               <dbl> 62.00000, 71.25887, 66.00000, 76.42917, 110.00000…
$ PEASCTM1             <dbl> 572.0000, 0.0000, 1007.0000, 554.7339, 673.0000, …
$ BMXWAIST             <dbl> 94.40000, 156.00000, 92.00000, 86.11608, 97.00000…
$ BMXBMI               <dbl> 31.92000, 58.13000, 29.55000, 26.99533, 25.76000,…
$ BMXHT                <dbl> 153.7000, 174.6000, 168.4000, 152.4810, 165.3000,…
$ BMXARMC              <dbl> 32.30000, 54.20000, 32.00000, 29.20228, 29.60000,…
$ BMXARML              <dbl> 33.20000, 41.80000, 36.20000, 33.37321, 37.20000,…
$ Poverty_Income_Ratio <dbl> 1.160000, 3.260000, 1.850000, 0.280000, 2.440000,…
$ BMXWT                <dbl> 75.40000, 177.20000, 83.80000, 65.08800, 70.40000…
$ Age                  <dbl> 35, 40, 52, 50, 14, 4, 56, 25, 12, 45, 33, 3, 40,…
$ DIABETES_factor      <fct> 0, 1, 0, 0, 0, 0, 1, 0, 0, 1, 0, 0, 0, 0, 0, 0, 0…
$ PC1                  <dbl> 0.1618906, 5.4191054, 0.8081946, 0.1253923, -0.72…
$ PC2                  <dbl> 0.88041681, 2.94120994, 1.95130317, -0.05317229, …
$ PC3                  <dbl> 0.13255599, -0.39551539, 0.08674368, 0.26886141, …
$ PC4                  <dbl> 0.56857209, 1.30967314, -0.06766784, 0.65707336, …
$ PC5                  <dbl> 0.32247866, 2.42519764, -0.56585948, 0.79657233, …
$ PC6                  <dbl> 1.42690957, -2.28819159, 1.55727562, 0.62629462, …
$ PC7                  <dbl> 1.11613718, 4.32023643, -0.35276793, -0.34089376,…
$ PC8                  <dbl> 0.0895124633, -0.5565730422, 0.5317360659, -0.567…
$ PC9                  <dbl> -0.64089491, -0.03689855, -0.58800084, -0.2145766…
$ PC10                 <dbl> 0.38161931, 0.13321781, -0.32139189, -0.49231855,…
$ PC11                 <dbl> 0.473591941, -0.078312744, -0.119743858, -0.18399…
$ PC12                 <dbl> 0.1446828607, 0.6681638637, -0.2102899935, -0.000…
$ PC13                 <dbl> 0.1362016900, 0.0179423936, -0.4607317349, 0.0119…
$ PC14                 <dbl> -0.1024173905, 0.0095358839, 0.2226078362, 0.0615…
$ PC15                 <dbl> -0.20946179, -0.42950098, -0.31750191, -0.1606166…
$ PC16                 <dbl> 2.107777e-01, -4.693024e-02, 3.016626e-02, -6.424…
$ PC17                 <dbl> -0.038872720, 0.122516960, -0.001755631, -0.07690…
$ PC18                 <dbl> -0.0683878914, 0.1794237009, 0.0408375138, -0.069…

Recall our features were

Code
features_65_num$feature
 [1] "BPXDI3"               "BPXSY3"               "BPXDI2"              
 [4] "BPXSY2"               "BPXDI1"               "BPXSY1"              
 [7] "BMXLEG"               "BPXML1"               "BPXPLS"              
[10] "PEASCTM1"             "BMXWAIST"             "BMXBMI"              
[13] "BMXHT"                "BMXARMC"              "BMXARML"             
[16] "Poverty_Income_Ratio" "BMXWT"                "Age"                 

We can make a formula:

Code
features_plus <- paste0(features_65_num$feature, collapse = " + ")
features_plus
[1] "BPXDI3 + BPXSY3 + BPXDI2 + BPXSY2 + BPXDI1 + BPXSY1 + BMXLEG + BPXML1 + BPXPLS + PEASCTM1 + BMXWAIST + BMXBMI + BMXHT + BMXARMC + BMXARML + Poverty_Income_Ratio + BMXWT + Age"
Code
feature_fomula <- paste0("DIABETES_factor ~ ", features_plus)
feature_fomula
[1] "DIABETES_factor ~ BPXDI3 + BPXSY3 + BPXDI2 + BPXSY2 + BPXDI1 + BPXSY1 + BMXLEG + BPXML1 + BPXPLS + PEASCTM1 + BMXWAIST + BMXBMI + BMXHT + BMXARMC + BMXARML + Poverty_Income_Ratio + BMXWT + Age"

Let’s also choose 5 random features for good measure

Code
set.seed(86753094)
feature_rand_5_formula <- paste0("DIABETES_factor ~ ", 
                                 paste0(sample(features_65_num$feature, 5, replace = FALSE ), 
                                        collapse = " + "))
feature_rand_5_formula
[1] "DIABETES_factor ~ BMXLEG + BPXSY3 + Poverty_Income_Ratio + BMXHT + PEASCTM1"

And now we can train our three models:

Code
logit_PCA <- glm(DIABETES_factor ~ PC1 + PC2 + PC3 + PC4 + PC5,
                 data = PCA.PCA.train,
                 family = binomial(link = 'logit'))

logit_features <- glm(as.formula(feature_fomula),
                      data = PCA.PCA.train,
                      family = binomial(link = 'logit'))

logit_rand_5 <- glm(as.formula(feature_rand_5_formula),
                     data = PCA.PCA.train,
                     family = binomial(link = 'logit'))

There is an issue: the test set does not know what it’s PCAs are at this moment, the PCA model was trained on the training set. Therefore, we will need to apply the PCAs model to the test set to get the predicted PCAs:

Code
PCA.PCA.test <- cbind(PCA.test, predict(A_DATA_2.pca.model, PCA.test)) 

We can utilize our helper from the last chapter,

NOTE THE CHANGES MADE BELOW

we added additional parameters for the target and the level, now this helper-function can be utilized with other data-frames that do not contain the column DIABETES_factor, this will still add on three additional columns to the data frame to be scored probs, pred and pred_factor where pred is set to 1 if over the mean probability score of the target at the level in the training dataset.

Code
logit_model_scorer <- function(my_model, my_data, target , level){ 
  # extracts models name 
  my_model_name <- deparse(substitute(my_model))
  
  enquo_target <- enquo(target)
  
  # store model name into a new column called model
  data.s <- my_data %>%
    mutate(model = my_model_name)
  
  # store the training data someplace
  train_data.s <- my_model$data
  
  # score the training data 
  train_data.s$probs <- predict(my_model, 
                                train_data.s, 
                                'response')
  
  # threshold query
  threshold_value_query <- train_data.s %>% 
                        group_by(!!enquo_target) %>%
                        summarise(mean_prob = mean(probs, na.rm=TRUE)) %>%
                        ungroup() %>%
                        filter(!!enquo_target == level)
  # threshold value                      
  threshold_value <- threshold_value_query$mean_prob
  
  # score test data
  data.s$probs <- predict(my_model, 
                          data.s, 
                          'response')
  
  # use threshold to make prediction  
  data.s <- data.s %>%
    mutate(pred = if_else(probs > threshold_value, 1,0)) %>%
    mutate(pred_factor = as.factor(pred))             
  
  # return scored data 
  return(data.s)
}

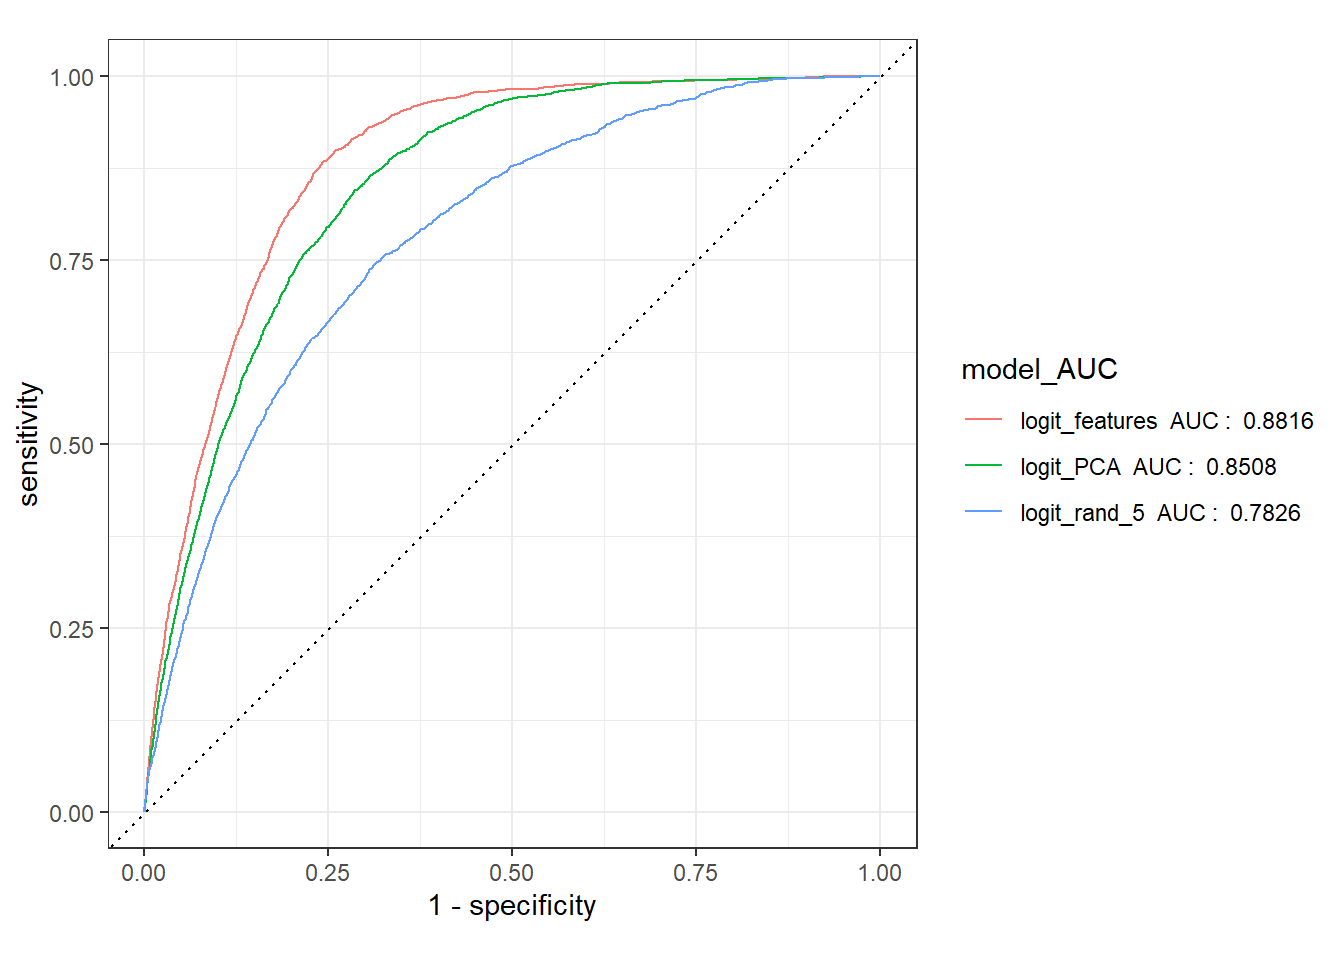
And we can get a quick comparison of the ROC Curves

9.6.5 Effectiveness of PCs as features

Code

Attaching package: 'yardstick'
The following object is masked from 'package:readr':

    spec
Code
compare_models <- bind_rows(
  logit_model_scorer(logit_PCA, PCA.PCA.test, DIABETES_factor, 1),
  logit_model_scorer(logit_features, PCA.PCA.test, DIABETES_factor, 1),
  logit_model_scorer(logit_rand_5, PCA.PCA.test, DIABETES_factor, 1),
) 


model_AUCS <- compare_models %>%
  group_by(model) %>%
  roc_auc(truth= DIABETES_factor, probs, event_level = "second") %>%
  mutate(model_AUC = paste(model , " AUC : ", round(.estimate,4)))

compare_models %>%
  left_join(model_AUCS) %>%
  group_by(model_AUC) %>%
  roc_curve(truth= DIABETES_factor, probs, event_level = "second") %>%
  autoplot()
Joining with `by = join_by(model)`

In this instance the model with the first 5 PCAs performed better than a model with 5 features chosen at random.

Code
Percent_Diff <- function(x,y){
   return(abs(x-y)/mean(x,y)*100) 
}


percent_diff_auc_Table <- model_AUCS %>%
  select(-model_AUC) %>%
  pivot_wider(names_from = model, values_from = .estimate) %>%
  mutate(percent_diff_auc.all_PCA = Percent_Diff(logit_features, logit_PCA)) %>%
  mutate(percent_diff_auc.PCA_rand_5 = Percent_Diff(logit_PCA, logit_rand_5)) 
  

percent_diff_auc_Table %>%
  glimpse()
Rows: 1
Columns: 7
$ .metric                     <chr> "roc_auc"
$ .estimator                  <chr> "binary"
$ logit_PCA                   <dbl> 0.850824
$ logit_features              <dbl> 0.8815747
$ logit_rand_5                <dbl> 0.782553
$ percent_diff_auc.all_PCA    <dbl> 3.488152
$ percent_diff_auc.PCA_rand_5 <dbl> 8.024109

So there’s only a 3.49% percent difference in Area between the logistic regression model with all of the features and the model with the first 5 PCs, and there is a 8.02% percent difference between the model with the first 5 PCs and a model with 5 features chosen at random.

9.7 k-means Clustering

k-means clustering that aims to partition \(n\) observations into \(k\) clusters in which each observation belonging to the cluster with the nearest mean (cluster centers or cluster centroid), serving as a prototype of the cluster.

Code
set.seed(657)
Sample_Id <- sample(A_DATA_2.Num.impute$SEQN, 
                    nrow(A_DATA_2.Num.impute)*.4, 
                    replace = FALSE)

DATA_65.impute.sample <- A_DATA_2.Num.impute %>%
  filter(SEQN %in% Sample_Id) %>%
  mutate(
    across(
      all_of(features_65_num$feature), 
      \(x){scale(x)}
      )
    )

9.7.1 How do we estimate the number of clusters?

Code
proc.kmeans <- function(data, k = 1:9){

kclusts <-
  tibble(k = k) %>%
  mutate(
    kclust = map(k, ~kmeans(data, .x)),
    glanced = map(kclust, glance),
    augmented = map(kclust, augment, data)
  )

kmeans_model <- function(final_k = 5){
   (kclusts %>%
     filter(k == final_k))$kclust[[1]]
}

id_vars <- colnames(kclusts)

cluster_assignments <- kclusts %>%
  unnest(cols = augmented)

vars <- setdiff(colnames(cluster_assignments), c(id_vars,'.cluster'))

within_cluster_variation_plot <- kclusts %>%
  unnest(cols = c(glanced)) %>%
  ggplot(aes(k, tot.withinss))  +
  geom_line() +
  geom_point() +
  labs(title = "Within Cluster Variation versus number of Clusters")

kmeans.pca <- cluster_assignments %>%
  select(all_of(vars)) %>%
  prcomp()

cluster_assignments_plot <- kmeans.pca %>%
  augment(cluster_assignments) %>%
  ggplot( aes(x = .fittedPC1, y = .fittedPC2, color = .cluster )) +
  geom_point(alpha = 0.8) +
  facet_wrap(~ k) +
  labs(title = "k-means clusterings")

return(list(cluster_assignments_plot= cluster_assignments_plot,
            within_cluster_variation_plot=within_cluster_variation_plot,
            kmeans_model = kmeans_model))
}
Code
library('broom')

tic <- Sys.time()

proc.kmeans.results <- proc.kmeans(DATA_65.impute.sample %>%
                                     select(all_of(features_65_num$feature)), 
                                   k = 3:11)
Warning: There was 1 warning in `mutate()`.
ℹ In argument: `kclust = map(k, ~kmeans(data, .x))`.
Caused by warning:
! Quick-TRANSfer stage steps exceeded maximum (= 1910900)
Code
toc <- Sys.time()

toc - tic 
Time difference of 2.338037 secs
Code
proc.kmeans.results$cluster_assignments_plot

Code
cluster_wgss <- function(data, nc=15){ 

clusters <- 1:nc 

wss <- purrr::map_dfr(clusters, 
                      function(N_Clusters){ 
                        wgss = sum(kmeans(data, centers = N_Clusters)$withinss) 
                        
                        tibble(N_Clusters, wgss) 
                        } ) 
} 
Code
DATA_65.impute.sample %>%  
  select(all_of(features_65_num$feature)) %>% 
  cluster_wgss(nc=10) %>%        
  ggplot(aes(x= N_Clusters, y= wgss)) + 
  geom_point() + 
  geom_line() +  
  labs(title = "Within group Sum of Squares Plot",
        x="Number of Clusters",
        y="Within groups sum of squares") 
Warning: did not converge in 10 iterations

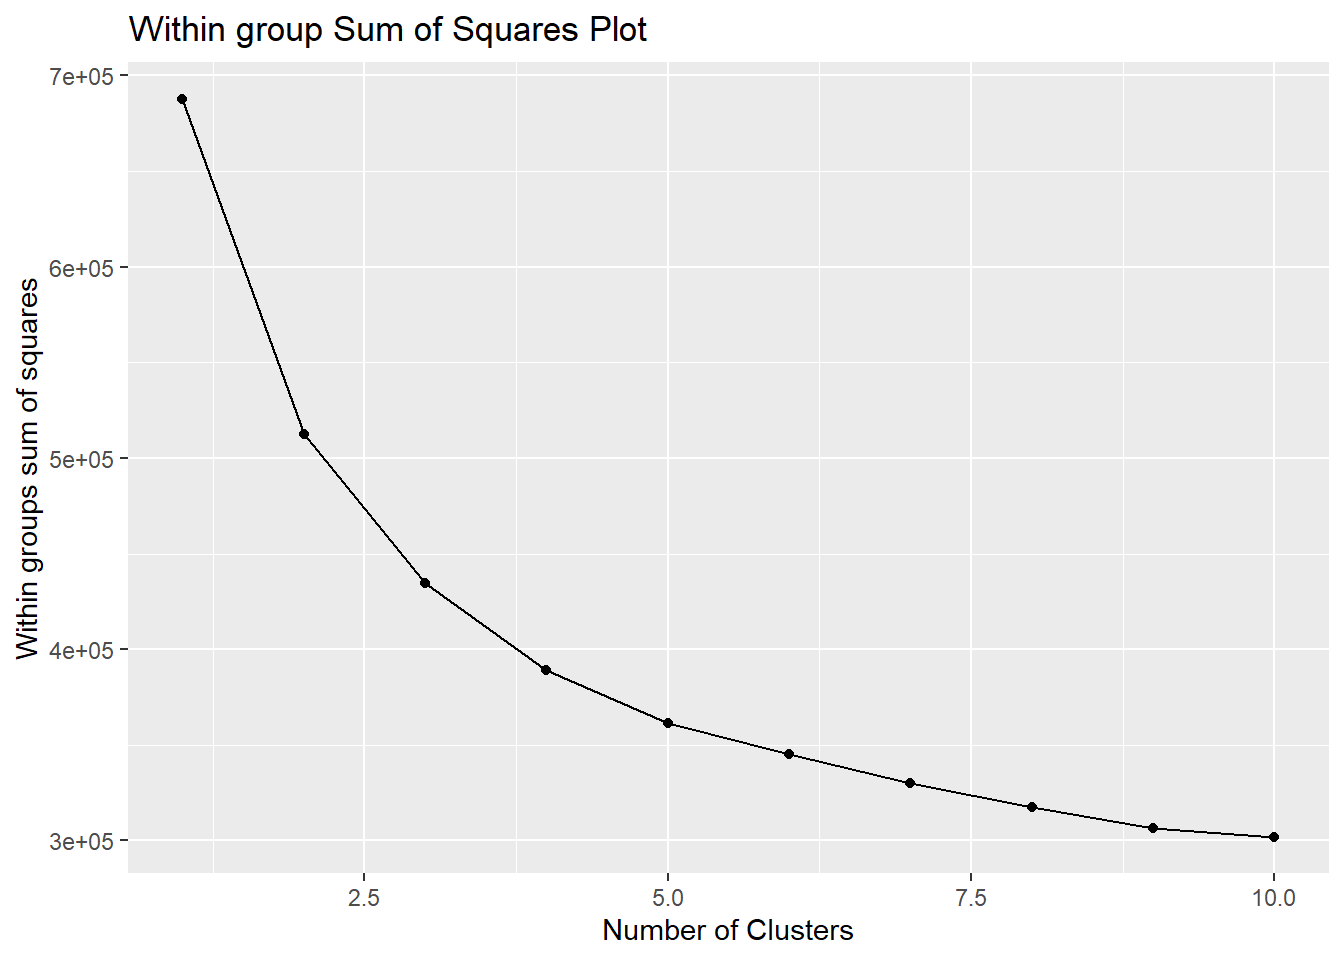
Above, we see a bend in the curve at around 5 so below we will run a kmeans experiment with (\(k\)) centers = 5.

kmeans has an additional options, here I chose 15 for the number of random starting positions:

Code
set.seed(12345)

km <- kmeans(DATA_65.impute.sample %>% select(all_of(features_65_num$feature)) , 
             centers = 5,
             iter.max= 15,
             nstart = 15)

We can now attach the clusters back to the data-frame:

Code
df.cluster <- cbind(DATA_65.impute.sample, cluster=km$cluster)

df.cluster %>%
  select(cluster, all_of(colnames(df.cluster)))  %>%
  head()
  cluster  SEQN DIABETES Gender             Race      Family_Income
1       3 55789        1   Male   Other Hispanic $55,000 to $64,999
2       4 75713        0 Female            Other $ 5,000 to $ 9,999
3       1 15437        1   Male Mexican American               <NA>
4       3 78051        0   Male            Other  $100,000 and Over
5       3  6340        0 Female            Black               <NA>
6       3  4173        0   Male            Black               <NA>
        BPXDI3      BPXSY3       BPXDI2      BPXSY2      BPXDI1       BPXSY1
1 -0.002926798 -0.27887716  0.145535072 -0.43689044  0.45485487  0.146699287
2 -0.315622005 -2.07646920 -0.327163735 -2.19401705 -0.64641716 -2.170554928
3  0.622463615 -1.43447204  0.618233879 -0.56239949  0.76950403 -0.585065202
4 -1.566402832 -0.15047772 -0.799862542 -0.06036331 -0.01711886  0.146699287
5  0.006057295  0.03312412 -0.007940145  0.03221977 -0.02590014 -0.003914424
6  0.622463615  0.36312000  0.460667610  0.06514573  0.45485487  0.268660036
       BMXLEG       BPXML1     BPXPLS    PEASCTM1    BMXWAIST      BMXBMI
1 -0.44639159  0.200775994 -0.5815039 -0.32108201  0.17860359 -0.04536005
2 -1.25743679 -1.346468894  0.6757638  0.89917628 -0.75929332 -0.95733064
3  0.96639683 -0.314972302  0.3165445 -0.23484467  1.27200673  0.82918924
4  0.99255958 -0.314972302 -0.5815039  0.50679641  0.20290144 -0.15346599
5  0.03931988 -0.004366641  0.1754762 -0.07645312 -0.01499759  0.22010027
6  1.82976753  0.200775994  1.0349831  0.81725081 -0.66696150 -0.79101381
       BMXHT     BMXARMC     BMXARML Poverty_Income_Ratio       BMXWT
1  0.6183841  0.37915562  0.49685231            1.1981448  0.28259068
2 -0.6103977 -0.93588713 -0.69156887           -1.3140066 -0.90840454
3  1.0428724  0.86879920  1.19405940            0.1308059  1.26139709
4  1.3869313  0.49107415  0.90883832            1.7708633  0.71381308
5 -0.1554794  0.05770916 -0.06198931           -0.2388719  0.03576730
6  0.9892528 -0.22240649  1.17821378           -1.4051209 -0.05280453
         Age DIABETES_factor
1  0.9736216               1
2 -0.8273815               0
3  0.5233708               1
4  0.3187114               0
5  1.1782810               0
6 -0.5408583               0

9.7.1.1 So what?

We can modify cat_feature_explore from Section ?sec-rewrite-functions-to-gain-speed-ups to create:

Code
proc_chi_square <- function(data, factor, feature){

  enquo_feature <- enquo(feature)
  enquo_factor <- enquo(factor)
  
  tmp <- data %>%
    select(!!enquo_factor, !!enquo_feature) %>%
    collect()
  
   table1 <- table(tmp) 
   
   table2 <- table(tmp %>% select(!!enquo_feature, !!enquo_factor) )
   
   plot_chi_square_residuals <-  vcd::mosaic(table2, gp = vcd::shading_max)
  
   plot_balloon <- gplots::balloonplot(table2, 
                                       main ="Balloon Plot for Gender by Diabetes \n Area is proportional to Freq.")
   
   return( list(Frequency_Table = table2,
                plot_chi_square_residuals = plot_chi_square_residuals,
                plot_balloon = plot_balloon))
   
}

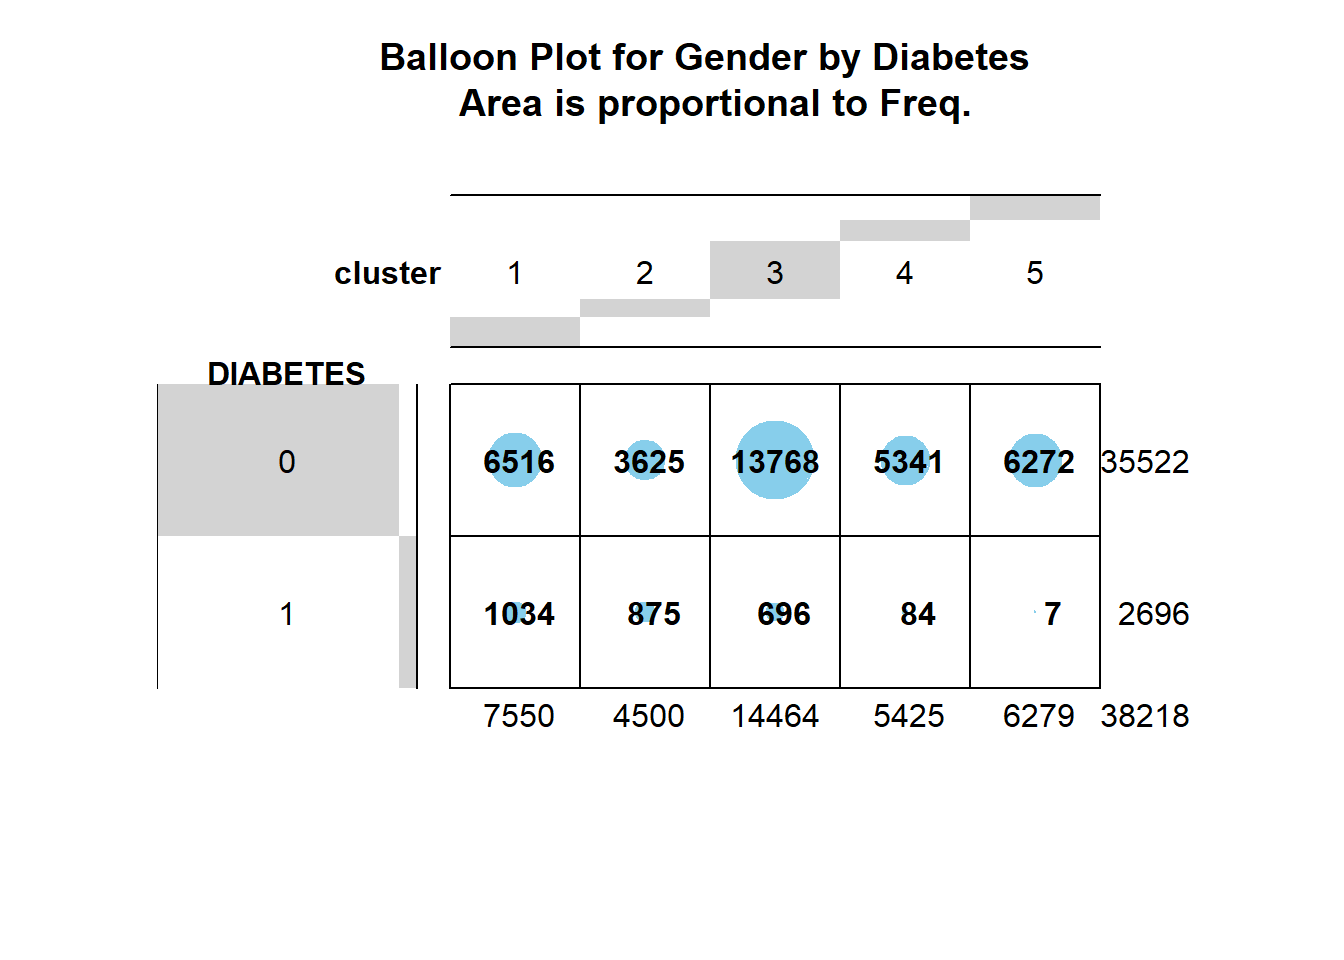
Now let’s run Chi-Square on it:

Code
proc_chi_square(df.cluster, DIABETES, cluster)

$Frequency_Table
       DIABETES
cluster     0     1
      1  6516  1034
      2  3625   875
      3 13768   696
      4  5341    84
      5  6272     7

$plot_chi_square_residuals
        DIABETES     0     1
cluster                     
1                 6516  1034
2                 3625   875
3                13768   696
4                 5341    84
5                 6272     7

$plot_balloon
NULL

9.7.2 Effectiveness of k-means clusters as features

If you’re still skeptical because df.cluster is a sample of A_DATA_2.Num.impute then we can project the clusters onto all of A_DATA_2.Num.impute:

Code
A_DATA_2.Num.impute_scale <- A_DATA_2.Num.impute %>%
  mutate(
    across(
      all_of(features_65_num$feature), 
      \(x){scale(x)}
      ))
Code
library(clue)

cluster <- clue::cl_predict(km,
                             A_DATA_2.Num.impute_scale %>% select(all_of(features_65_num$feature))
                            )

A_DATA_2.Num.impute_scale$.cluster <- factor(as.numeric(as.character(cluster)))

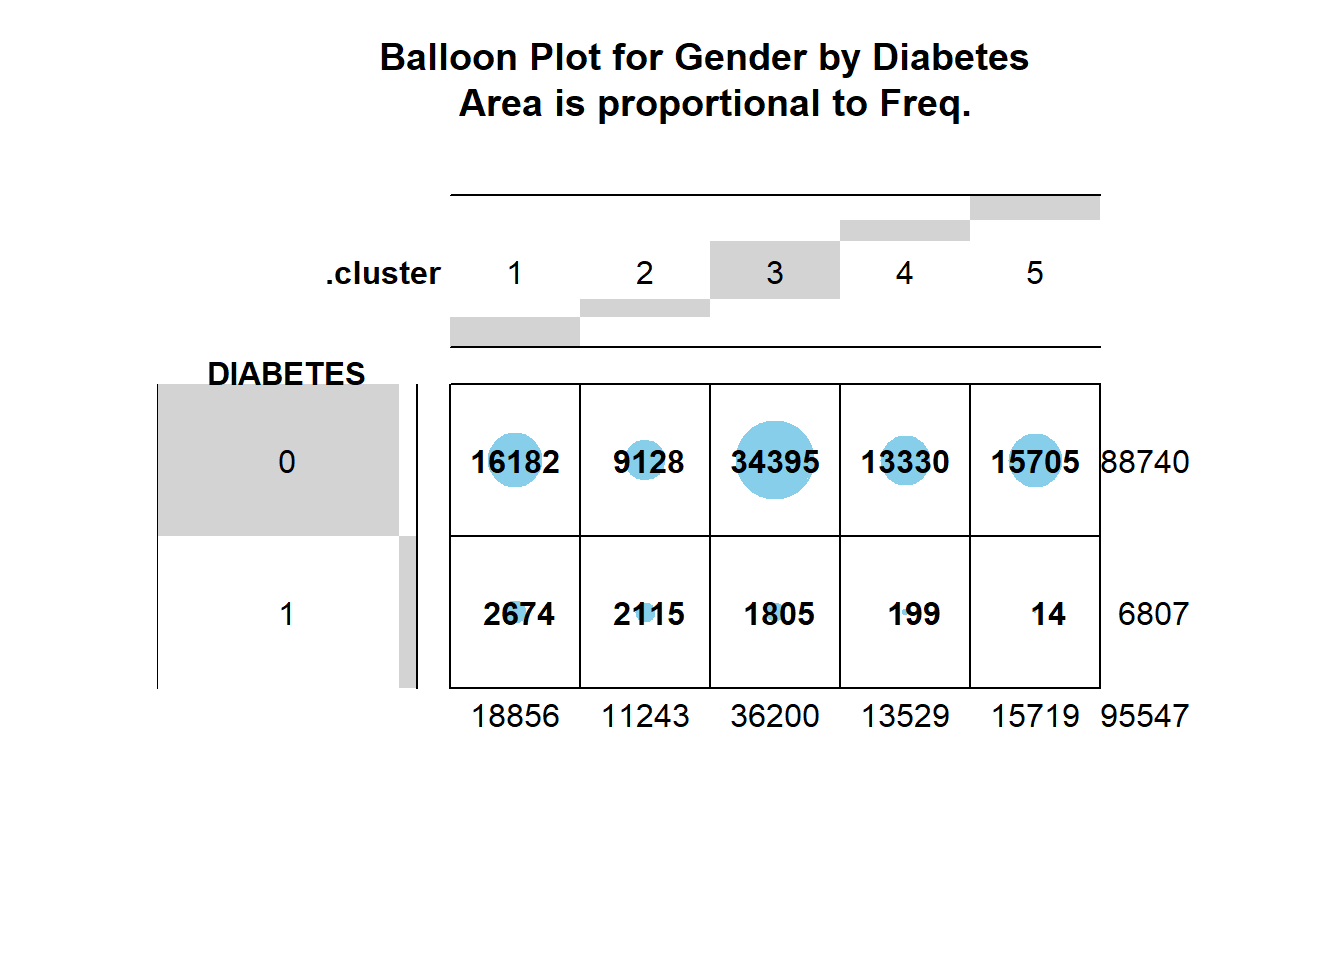
Now run proc_chi_square on it:

Code
proc_chi_square(A_DATA_2.Num.impute_scale, DIABETES, .cluster)

$Frequency_Table
        DIABETES
.cluster     0     1
       1 16182  2674
       2  9128  2115
       3 34395  1805
       4 13330   199
       5 15705    14

$plot_chi_square_residuals
         DIABETES     0     1
.cluster                     
1                 16182  2674
2                  9128  2115
3                 34395  1805
4                 13330   199
5                 15705    14

$plot_balloon
NULL

Above, we can see Diabetics are much more concentrated in Clusters 2, 3, & 4 than the others.

Code
A_DATA_2.Num.impute_scale %>%
  group_by(.cluster) %>%
  summarise(N_Diabetic = sum(DIABETES)) 
# A tibble: 5 × 2
  .cluster N_Diabetic
  <fct>         <dbl>
1 1              2674
2 2              2115
3 3              1805
4 4               199
5 5                14

9.8 Packages for Automated Exploratory Data Analysis

There are also packages that can assist with automated EDA. Two such packages which we will point to as a reference are DataExplorer and skimr.